Tableau Software, the global leader in visual analytics,
has announced the general availability of Tableau 10.3. This release helps organisations achieve data-driven insights more quickly.
“Organisations
want to do more with the vast data they have at their disposal,” said
Francois Ajenstat, Chief Product Officer at Tableau. “It’s not just
simple analysis our customers are looking seeking, it’s the power to
unlock all of their data with ease and efficiency. With smart
recommendations, customers can get to the right data faster than ever -
without having to spend time finding the right tables and joins. And
with proactive monitoring of key metrics through features like data
driven alerts, they can take action immediately and be more agile.”
The upgraded software offers automated table and join* recommendations powered by
machine learning algorithms. Tableau Server analyses aggregate data source usage
to recommend popular tables and correlated data across the
organisation. With recommendations, customers can save time by quickly
identifying database tables that are relevant to their analysis and
leveraging join recommendations to enrich their data.
It also includes data-driven alerts for proactive
monitoring of key metrics. Version 10.3 unlocks six new data sources for
analysis, including a new connector for extracting data from
PDF documents. Additionally, Tableau Online customers are able to try
Tableau Bridge in beta, which enables a direct connection to data stored
on premises directly in the cloud.
In
all, customers can now connect to more than 75 data sources via 66
connectors, without any programming. That includes a new PDF connector, which
allows people to directly import PDF tables into Tableau with a click. Additionally,
Tableau now comes with new connectors to popular data sources such as
Amazon Athena, ServiceNow, MongoDB, Dropbox, and Microsoft OneDrive.
Tableau
Online customers can now leverage data stored on premises directly in
the cloud with the new Tableau Bridge. Available to all Tableau Online
customers to try, this will allow a secure, live connection to on
premises data, meaning it’s no longer necessary to move data to perform a
live query from Tableau Online. Many organisations have data on
premises and in the cloud, and Tableau Bridge allows these customers to
easily connect live to all of their data no matter where it is.
*A join refers to combining related data from different parts of a database. An example would be a database of customer names and other details, which could be joined with a database of orders for products so that a business can tell who orders what.
Showing posts with label visualisation. Show all posts
Showing posts with label visualisation. Show all posts
23 June 2017
15 June 2016
Qlik app identifies Hong Kong as most expensive city in APAC
 |
| Screen capture from the app. |
Qlik has created a web-based app for consumers to allow them to compare the cost of living across eight key cities in the Asia Pacific (APAC) region. Built on Qlik Sense, the Qlik APAC Cost of Living app focuses on living costs in Hong Kong, Kuala Lumpur, Mumbai, Seoul, Shanghai, Singapore, Sydney and Tokyo.
The app uses embedded visual analytics to present a cross-section of goods such as property, transport, education, entertainment, utilities, food, restaurants and clothing, in addition to allowing users to view the data by 'budget', 'mid-range' or 'expensive' cost ranges across any category.
 |
| Source: Qlik infographic. While Kuala Lumpur, Mumbai and Shanghai score below the APAC average on almost every item in the comparison basket, the other cities scored above the regional average in various categories. |
Deeper insights
With heat maps, the app can instantly illustrate how the prices of individual items in various countries differ from the APAC average.
“With the constant fluctuations in Asian economies and changing consumer price indices (CPI), getting to grips with the cost of maintaining a certain standard of living before you move somewhere can be difficult,” said Phillip Beniac, Regional Vice President, Asia Pacific for Qlik.
“The Qlik APAC Cost of Living app takes the pain out of the process by using visual analytics to compare the average cost of living in various cities. Easy to assimilate visual representations enable expatriates, as well as local residents, to compare selected APAC cities side by side, and drill into the data to find out how their city of choice stacks up against the rest.”
Beniac added that the app enables storytelling. "You can click deeper into the active data. It is not a static Powerpoint," he said. "This is about discovery, this is about insight."
Using heat maps, the Qlik APAC Cost of Living app instantly illustrates how the prices of individual items in various countries differ from the APAC average, with red highlighting the costliest and blue denoting the least expensive. A ‘Highs and Lows’ page enables users to track prices of particular items – from alcohol and entertainment to clothing and household essentials – across Asia Pacific.
Japan’s most populated city, Tokyo, takes the overall title as the most expensive city, with costs 39% higher than the APAC average. However, delving deeper into the data reveals that all is not how it may seem. For example, looking only at the ‘Expensive’ category of items shows that Hong Kong usurps Tokyo as the most expensive city to live the high life. At the other end of the spectrum, exploring ‘Budget’ costs shows Sydney elevated in the rankings to second behind only Tokyo.
“APAC is well regarded as an attractive location for expats and also sees a great deal of mobility from within the region, with potential to accelerate due to recent initiatives such as the Asian Economic Community formed in December 2015,” commented Professor Wong Poh Kam, National University of Singapore (NUS) Business School.
“Part of this attractiveness of the region is the perceived low cost of living in various countries. However, cost of living standards can often be misunderstood unless people have access to a good level of detailed information that informs them what it will cost to live their particular lifestyle. For example, not everyone wants or needs to own a car, which can be a particularly expensive proposition in some APAC cities, especially Singapore and Tokyo, where the public transport network is already extensive.”
Some of the most interesting insights include:
Although Shanghai’s cost of living data places it 11% lower than the APAC average, it is the most expensive city to stay in shape, with a monthly gym membership costing US$157 and a session with a personal trainer costing US$393. In contrast, although Seoul has a similar overall cost of living to Shanghai coming in at 10% lower than average, a monthly gym membership will set you back just US$30, while a personal trainer session costs only US$72.
While Sydney is known for being a gourmet paradise, it is also the priciest place in APAC to eat out in hotel restaurants, with a meal for two costing up to US$247. That is about twice what it costs in Shanghai (US$133) or Tokyo (US$116), while Seoul is the cheapest choice (US$53), followed by Mumbai (US$61) and Hong Kong US$70).
In terms of finding a place to live, Kuala Lumpur is most attractive option for people who like to live in the city centre, with property costing US$331 per sq ft to buy and US$1.11 per sq ft to rent. Hong Kong tops the city centre list at US$2,002 per sq ft to buy and US$6.52 per sq ft to rent. On the other hand, if renting in the inner suburbs, then Mumbai (US$0.24 per sq ft), Kuala Lumpur (US$0.41 per sq ft) and Sydney (US$0.9 per sq ft) are the most attractive.
The app also casts light on some enormous cost disparities. For example, the cost of sending one student to an international school in Shanghai (US$45,229) is the equivalent of sending 22 to an international school in Mumbai (US$2,016).
“In the same way that organisations now routinely use business intelligence, individuals are seeking ways to use everyday data to analyse and derive insights into what’s going on in their lives. The Qlik Cost of Living app is a great example of how you don’t have to be a data scientist to get useful insights from data, by using visual analytics,” added Beniac.
CK Tan, Senior Manager, Product Marketing, Asia Pacific, Qlik, said that the mobile-ready app would be of interest to people planning to relocate across countries, or those who want to travel.
The app will be updated at least annually and is likely to see more cities added as well as more categories. While the apps it has created are free, Qlik does not rule out monetisation in the future.
Interested?The Qlik APAC Cost of Living app, built on Qlik Sense, is based on data collected from varied sources including desktop research as well as surveys of regional retail chains and hotels. Download the app
Explore other Qlik apps - one of the latest is on the UEFA Euro 2016 football championships
posted from Bloggeroid

11 May 2016
Qlik offers visual analytics in the cloud for business
Qlik, a visual analytics provider, has announced Qlik Sense Cloud Business. Qlik Sense Cloud Business enables users to create, manage, and collaborate with visual analytics in the cloud. The subscription-based cloud offering extends the power of data-driven insights to users and groups throughout an organisation.
Qlik Sense Cloud Business has an intuitive design that enables users of all technical skill levels to quickly and easily create, manage, and collaborate with meaningful analytic apps. Responsive design capabilities offer analysis on-the-go from any device – regardless of device size – including touch, drill, and interact features, with no additional development necessary. In addition, data management capabilities empower users to combine data from diverse sources, including in the cloud, uploaded from on-premise, and third-party apps, to quickly create rich, interactive apps. This user experience is underpinned by Qlik’s Associative Model, which enables users to probe all the possible associations that exist across all of their data.
Deliver value faster
The existing Qlik Sense Cloud Basic and Plus offerings provide individuals with all the advantages of Qlik Sense combined with the ability to easily share analysis and insights. Qlik Sense Cloud Business adds additional security and governance features, with a focus on empowerment. The cloud-based model allows organisations to add new users and apps as requirements change, with the elasticity to support current and future needs.
A group work area allowing users to collaboratively create, edit, and access group content and apps, enhancing collaboration without limiting flexibility.
Group data space enabling all users to contribute data that contains reusable and consistent definitions, expediting the process of creating new apps and eliminating the guesswork in maintaining apps as business requirements evolve over time.
Group shared networks that offers multiple shared networks or streams that users may be invited to follow, enabling control for which users have access to which apps.
“Our cloud strategy encompasses more than just an infrastructure or software-as-a-service play,” said Anthony Deighton, Qlik CTO and SVP of Products. “At Qlik we see an exciting opportunity for cloud-based value-added services to optimise the visual analytics experience. Likewise, because people do not make decisions alone, sharing in the cloud will always be an important part of our collaboration strategy.”
Qlik Sense Cloud Business has an intuitive design that enables users of all technical skill levels to quickly and easily create, manage, and collaborate with meaningful analytic apps. Responsive design capabilities offer analysis on-the-go from any device – regardless of device size – including touch, drill, and interact features, with no additional development necessary. In addition, data management capabilities empower users to combine data from diverse sources, including in the cloud, uploaded from on-premise, and third-party apps, to quickly create rich, interactive apps. This user experience is underpinned by Qlik’s Associative Model, which enables users to probe all the possible associations that exist across all of their data.
Deliver value faster
The existing Qlik Sense Cloud Basic and Plus offerings provide individuals with all the advantages of Qlik Sense combined with the ability to easily share analysis and insights. Qlik Sense Cloud Business adds additional security and governance features, with a focus on empowerment. The cloud-based model allows organisations to add new users and apps as requirements change, with the elasticity to support current and future needs.
Qlik Sense Cloud Business includes:
A group work area allowing users to collaboratively create, edit, and access group content and apps, enhancing collaboration without limiting flexibility.
Group data space enabling all users to contribute data that contains reusable and consistent definitions, expediting the process of creating new apps and eliminating the guesswork in maintaining apps as business requirements evolve over time.
Group shared networks that offers multiple shared networks or streams that users may be invited to follow, enabling control for which users have access to which apps.
“Our cloud strategy encompasses more than just an infrastructure or software-as-a-service play,” said Anthony Deighton, Qlik CTO and SVP of Products. “At Qlik we see an exciting opportunity for cloud-based value-added services to optimise the visual analytics experience. Likewise, because people do not make decisions alone, sharing in the cloud will always be an important part of our collaboration strategy.”
The company has also previewed Qlik Sense Enterprise 3.0, the newest release of its business intelligence (BI) and analytics solution that will be available in June 2016. Qlik Sense Enterprise 3.0 combines enterprise readiness and governance with visualisation and data preparation capabilities, allowing organisations to meet a broad range of BI use cases from a single platform.
With this latest release, Qlik has improved its management and administration capabilities to support IT with more effective auditing, configuration, and governance for broad multi-geography deployments. New user interface enhancements in the Qlik Management Console (QMC) provide configuration options for content and resources. In addition, Qlik Sense Enterprise is now available in Korean, Traditional Chinese, and Turkish.
Developers are empowered with a new development hub. This includes new developer APIs and capabilities, including an app integration API, a visualisation API for programmatic creation of analytics, and a new integrated developer environment (IDE) plugin for Visual Studio.
“Qlik built the category for user-driven, self-service BI. With Qlik Sense, we continue to expand the market by creating a scalable, secure, and extensible platform that organisations can consider the centrepiece of their enterprise-wide BI deployment,” said Deighton.
With this latest release, Qlik has improved its management and administration capabilities to support IT with more effective auditing, configuration, and governance for broad multi-geography deployments. New user interface enhancements in the Qlik Management Console (QMC) provide configuration options for content and resources. In addition, Qlik Sense Enterprise is now available in Korean, Traditional Chinese, and Turkish.
Developers are empowered with a new development hub. This includes new developer APIs and capabilities, including an app integration API, a visualisation API for programmatic creation of analytics, and a new integrated developer environment (IDE) plugin for Visual Studio.
“Qlik built the category for user-driven, self-service BI. With Qlik Sense, we continue to expand the market by creating a scalable, secure, and extensible platform that organisations can consider the centrepiece of their enterprise-wide BI deployment,” said Deighton.
"Our platform approach allows us to address such a breadth of use cases with more depth than other offerings. The openness of our platform expands opportunities for custom analytics apps, embedded BI, and developer innovation. With our industry-leading global partner network at the ready to bring these solutions to market and our rapidly growing community of developers, we’ve hit an exciting point in the next phase of industry leadership, extending beyond visual analytics.”
More intuitive app creation, visual analysis, and collaboration
More intuitive app creation, visual analysis, and collaboration
Users will benefit from new visual search capabilities that allow them to search across charts and data. In addition, visual exploration capabilities now allow users to explore and discover insights in analyses using governed metrics and dimensions. Additional functionality improves business user app creation, including time aware charts, automatic detection of geographic data, and improved application of data-driven colour palettes.
Several new features facilitate sharing and collaboration, including storytelling that allows data stories to be directly published to Microsoft Office and PDF. In addition, Qlik Nprinting, which previously supported only QlikView, now supports Qlik Sense. This enables organisations with legacy reporting environments to move aggressively to a modern BI architecture while maintaining their requirement for statutory or compliance reporting and extending more interactive analysis to business leaders.
Several new features facilitate sharing and collaboration, including storytelling that allows data stories to be directly published to Microsoft Office and PDF. In addition, Qlik Nprinting, which previously supported only QlikView, now supports Qlik Sense. This enables organisations with legacy reporting environments to move aggressively to a modern BI architecture while maintaining their requirement for statutory or compliance reporting and extending more interactive analysis to business leaders.
Interested?
Qlik Sense Cloud Business will be available in the second half of 2016.
11 April 2016
Make communications more effective by going visual
 |
| Mark McCrindle, Social Researcher, McCrindle Research, speaks at a keynote during the Tableau on Tour roadshow in Singapore. |
"We live in a visual world, we are visual people...We process visuals far more quickly, that's why safety messages are always in visual form."
According to McCrindle, Excel spreadsheets may convey data, but visuals do it more effectively. He praised the visuals available from the Department of Statistics (SingStats) in Singapore - "(they've) got more infographics than I have ever seen on any statistical website in any country" - and shared some of the infographics from the SingStats site during his keynote.
McCrindle also pointed out that communication is changing as different generations speak a different language. Generation Z in particular is extremely mobile, digital, and visual in terms of information is processed, he said. Interactive data is the type of data that they respond to, he noted.
"In this decade we have entered the great screen age, and this has changed the way we process information," he said. "If we want to connect with a global, mobile, social generation we have to find new ways of communicating."
Other factors that contribute to effective communication include relevance and responsiveness to change. "It's data storytelling," he explained.
A selection of slides from McCrindle's presentation:
 |
| The visual element in 'research', 'insight' and 'foresee'. |
 |
| Some of the visualisations available on Singapore's Singstats website. |
 |
| The three symbols that Gen Z are most afraid of. |
 |
| An example of a visual sign which is now outdated, and hence irrelevant for visual communication. The stylised figure of a swimmer with hands up in distress can also be read as the popular social media acronym LOL, or 'laugh out loud'. |
Interested?
View infographics from the Department of Statistics, Singapore
View visualisations made with Tableau Public
Get a free trial of Tableau
Read the TechTrade Asia blog posts about building a Smart Nation and empowering users with data visualisation
Hashtags: #data16, #smartnation
25 September 2015
Pixelglow Software updates Instaviz, launches free lite version
 |
| Source: iTunes. Instaviz 2.1 screen. |
"Our customers absolutely love our rebuilt Instaviz 2, giving us 75% 5-star reviews since our relaunch in June," says developer Glen Low, winner of two Apple Design Awards. "With the new free Instaviz Lite, even more users will see how easy it really is, turning doodles into diagrams."
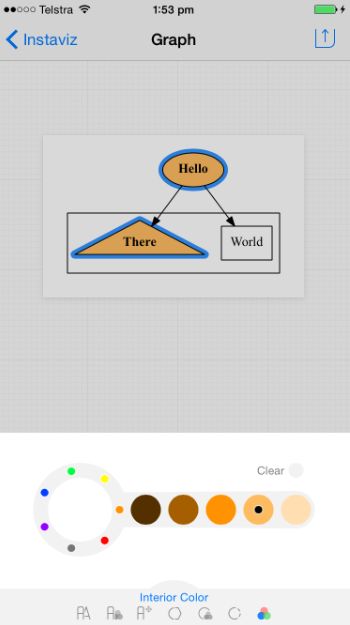
Instaviz users create formal diagrams by beginning with rough sketches of shapes, typing in some text, then linking the shapes together. Instaviz and Instaviz Lite neaten and rearrange them as the users work. With the paid app, the users can refine their ideas with different fonts, colours, styles and shapes. The diagrams can be shared on the paid app in different formats and through different channels, including email, message, print, AirDrop, and a number of popular social networks such as Facebook, Flickr, Pinterest, Twitter or WhatsApp.
"This is the best simple visual thinking, simple diagramming or back-of-the-napkin thinking app available for the iPhone and iPad," said Dr George Huba, a prominent mind-mapping and healthcare advocate. "And, unlike the napkin you draw on at lunch, diagrams from the program can look good enough to use in books and professional journals without further enhancements. And unlike those napkins, the diagrams from Instaviz come without ink smears, coffee cup rings, and grease stains from errant French fries, freedom fries, chips, British fish and chips, sweet potato fries, tempura, or pizza!"
Instaviz is built on two key technologies: Recog and Graphviz. Recog is a new shape recognition library. Trained on over 2,500 sketches drawn by real users, Recog uses advanced fuzzy logic and sophisticated geometric algorithms to recognize sketches in a split second. Graphviz is an automated graph layout engine. The industry standard for automated graph layout, Graphviz represents over 20 years of AT&T information visualisation research.
Interested?
Download the PC/Mac companion app, Instavue (Instaviz app on a mobile device required)
7 June 2015
iOS conceptualisation tool Instaviz 2.0 debuts
Pixelglow Software, which focuses on developing intuitive business applications, has launched Instaviz 2.0. Released in December 2008, Instaviz allows users to visualise, refine and share ideas and concepts, and is one of the most popular diagramming apps on the iOS platform.
Instaviz is regularly seen in the Top 100 Business Apps list at the App Store, and over 17,700 copies have been purchased, Pixelglow says. Users have rated it three-and-a-half out of five stars at the App Store.
"Here's what I like about it," said Terry White, Worldwide Design Evangelist for Adobe Systems. "I don't have to worry about picking tools to draw the various shapes. I have a tool right here: it's my finger!"
Users start by sketching some rough shapes, adding some text, then linking the shapes together. Instaviz neatens the shapes and arranges them elegantly as the users work, turning them into coherent diagrams that can be customised with different fonts, colours, styles and shapes. The work can be shared through email, messages, or AirDrop, as well as on social media such as Facebook, Twitter or WhatsApp.
 Version 2.0 is a major rewrite of what the company says is the first iOS diagram sketcher. Diagrams, mind maps and flowcharts can be shared more easily with the new version, said Australia-based Pixelglow Developer Glen Low.
"I've always seen Instaviz as an extension of my mind," Low said. "When I have an idea or relation in my head, I want to get it down quickly without fussing about where to place the concepts, or getting stuck in endless popups and modes. In pursuing that seamless experience for all users, I've rebuilt the app from the ground up over 4.5 years to create this new version."
Low has revamped the user interface and included help demo videos for the upgraded app. New features include:
Instaviz 2.0* is US$7.99 and available worldwide exclusively through the App Store Productivity category. Existing users can upgrade for free. Multiple languages are supported, including English, Chinese (Simplified), Chinese (Traditional), and Japanese.
Interested?
Purchase the app
*Device requirements: iPhone 4, iPad 2, iPod Touch 5G or better; iOS 7, 8 or better; 4MB of space.
 |
| Source: Pixelglow Software. Click on the image to view a larger version. |
Instaviz is regularly seen in the Top 100 Business Apps list at the App Store, and over 17,700 copies have been purchased, Pixelglow says. Users have rated it three-and-a-half out of five stars at the App Store.
"Here's what I like about it," said Terry White, Worldwide Design Evangelist for Adobe Systems. "I don't have to worry about picking tools to draw the various shapes. I have a tool right here: it's my finger!"
Users start by sketching some rough shapes, adding some text, then linking the shapes together. Instaviz neatens the shapes and arranges them elegantly as the users work, turning them into coherent diagrams that can be customised with different fonts, colours, styles and shapes. The work can be shared through email, messages, or AirDrop, as well as on social media such as Facebook, Twitter or WhatsApp.
"I've always seen Instaviz as an extension of my mind," Low said. "When I have an idea or relation in my head, I want to get it down quickly without fussing about where to place the concepts, or getting stuck in endless popups and modes. In pursuing that seamless experience for all users, I've rebuilt the app from the ground up over 4.5 years to create this new version."
Low has revamped the user interface and included help demo videos for the upgraded app. New features include:
- Fresh graphics, icons and toolbars
- Improved layout, text, animation, interaction and rendering
- Enhanced font, colour and style settings
- Sharing through email, message, print, over-the-air and social media
- Help demo videos
- Support for iOS 7 and 8
- Compatibility with iPhone 5, 6, and 6+ screen formats
Instaviz 2.0* is US$7.99 and available worldwide exclusively through the App Store Productivity category. Existing users can upgrade for free. Multiple languages are supported, including English, Chinese (Simplified), Chinese (Traditional), and Japanese.
Interested?
Purchase the app
*Device requirements: iPhone 4, iPad 2, iPod Touch 5G or better; iOS 7, 8 or better; 4MB of space.
17 March 2015
Tableau Public gets revamp as participation heats up
 |
| Source: Tableau Public gallery. Tableau Public visualisation of the world's largest stadiums. Interact with the visualisation here. |
Tableau has shared that 36,000 people joined Tableau Public in 2014 and published more data stories than ever before on its free platform for creating, sharing and discovering data stories on the web. Tableau Public consists of a downloadable authoring tool to explore and visualise data, a cloud platform to host, share and embed interactive visualisations and a learning program that provides support and training to hundreds of thousands of data enthusiasts around the world.
Since its launch in 2010, authors have published more than 500,000 visualisations on Tableau Public – nearly half of which were published in 2014 alone. “We launched Tableau Public with the vision of giving people a place to express a new form of storytelling. We believe data is a great conversation starter that can be both emotive and rationale,” said Ben Jones, Director for Tableau Public. “We now have 90,000 of these world citizens who are helping us see and understand what’s happening around our world.”
In Asia, visualisations created on the Tableau Public platform include one on dengue fever in Singapore created by David Murphy of Datasaurus-Rex, which allows users to look at the patterns in dengue fever cases and mosquito breeding habitats in Singapore. Another visualisation on the Indonesian Presidential Election 2014 by Rina Bongsu-Petersen was highlighted in Tableau’s daily mailer as a “viz of the day" when it was shared.
A redesigned web platform has been launched and is now on open beta. Search has been rebuilt while the publishing experience has been improved. Maps are now searchable as well. Other new features include:
· New profile pages: Dedicated pages for authors that enable them to edit and manage their portfolio of visualisations and showcase their work with others.
· New Viz toolbar: Every visualisation comes with a new toolbar that helps people interact and explore their own view of the story. People can edit, download, embed, navigate, or restore views.
· New resources and gallery: An expanded set of sample data sets plus a revamped gallery, and a curated set of the best visualisations of all time.
In Asia, visualisations created on the Tableau Public platform include one on dengue fever in Singapore created by David Murphy of Datasaurus-Rex, which allows users to look at the patterns in dengue fever cases and mosquito breeding habitats in Singapore. Another visualisation on the Indonesian Presidential Election 2014 by Rina Bongsu-Petersen was highlighted in Tableau’s daily mailer as a “viz of the day" when it was shared.
12 December 2014
The free tool for creating interactive data visualisations
 |
| Source: Tableau Public website. |
Tableau Software, a company all about "making databases and spreadsheets understandable to ordinary people", has given us the capability to create interactive infographics with Tableau Public, a free tool whose visualisations can be embedded into web pages. Tableau Public is not new - videos showing how it works are available on YouTube from as far back as 2010 - but it is likely to become more popular now that infographics have become more common.
A blog post by Tableau Software dated 8 December shows that it is still relevant, as does the fact that JY Pook, VP, Asia Pacific, Tableau Software, was demonstrating the product at a recent Christmas party in Singapore. Ellie Fields, VP of Product Marketing, says in the blog post that "I also want to take this chance assure you that Tableau Public will remain free. We do offer a paid premium version of Tableau Public for those who want a few extra features. But what really keeps our lights on is Tableau’s business products like Tableau Desktop, Tableau Server and Tableau Online."
Creating an interactive data visualisation and creating a successful interactive infographic are two completely different things, however. The choice of what data to visualise, how the end-product is displayed, and even the choice of colours can be crucial to how attractive an infographic is. Would-be infographic makers should study successful infographics as well as browse the Tableau Public microsite's gallery before they start. The good news is that creating visualisations should be a snap thereafter.
Download Tableau Public here and read the blog post about successful infographics here.
Subscribe to:
Posts (Atom)