Showing posts with label worldwide. Show all posts

11 September 2016

SUVs drive car sales: Euromonitor

Global market research company Euromonitor International has determined that global sales of light vehicles grew 1.7% in 2014-2015, driven by the increasing popularity of sports utility vehicles (SUVs), sales of which surged 22% since 2015.

SUVs overtook lower medium cars to become the largest automotive segment in 2015, accounting for 22.9% of light vehicle sales globally. Sales of SUVs grew from 5 million units in 2000 to 20 million in 2015 and are forecast to hit 42 million units by 2031.

Mykola Golovko, Project Manager at Euromonitor International, comments: “The popularity of SUVs in the early 2000s has precipitated a rush of companies trying to capitalise, with a growing number of brands and new concept offerings like crossovers to appeal to a wider audience.”

An increasing number of consumers in key emerging markets will be in a position to trade up from smaller cars to SUVs. However, a combination of key social changes such as urbanisation, smaller households and an ageing population, in conjunction with increasing emissions regulations, have also boosted the fortunes of the small car segment.

Euromonitor predicts that small cars will see a global CAGR of 2.9% between 2015 and 2031 but this is firmly secondary to the projected CAGR of 4.8% for SUVs. The fastest growing SUVs markets in 2014-2015 for Asia were:

Thailand: +56.4%
China: +47.9%

Golovko concludes: “We’ve seen dynamic growth across most segments and markets through 2015, as pent-up demand from the 2009 recession was realised. However, replacement demand in developed markets will start to slow and global growth will be increasingly reliant on SUVs and emerging markets.”

posted from Bloggeroid

12 June 2016

Investors more confident about FDI placement in Singapore

Singapore is in the top-ten list in the 2016 AT Kearney Foreign Direct Investment (FDI) Confidence Index*. The city-state jumped five places – the biggest rise in rankings - to take the 10th spot in this year’s index.

The index is a forward-looking analysis of how political, economic, by  regulatory changes will likely affect FDI inflows into countries in the coming years. Since its inception in 1998, the study has reliably pointed toward firms’ top choices globally for FDI, with the countries ranked in the index tracking closely with the destinations for actual global FDI inflows.

The index is constructed using primary data from a proprietary survey administered to senior executives of the world’s leading corporations. In this year’s survey, 31% of the respondents said they were more optimistic about Singapore’s economic outlook over the next three years, compared to a year ago.

“Singapore has established itself as a regional financial hub. Its robust economy, stable political environment, corruption free establishment and an educated talent pool have made it an attractive destination for global firms,” said Soon Ghee Chua, Partner and Head of Southeast Asia at global management consulting firm AT Kearney.

“Singapore is consistently ranked as one of the easiest places to do business. That has seen major global companies set up their regional headquarters here. Singapore is also a member of the Association of Southeast Asian Nations (ASEAN) further adding to its lure for companies looking to tap into the 10-nation economic bloc’s growth potential. All of this has contributed to the growth in FDI into the country.”

The results of the index also show that domestic market size, cost of labour, regulatory transparency and lack of corruption are among the top factors that executives look at when making decisions about investing in a country.

Overall, five Asian countries feature in the top-ten rankings in this year’s index, highlighting the confidence global business leaders have in the region:

  • China: Ranked second for the fourth year in a row.
  • Japan: Continues to rise in the rankings, up one spot this year to 6th place.
  • Australia: Jumped three spots to take 7th place.
  • India: Jumped two places to re-enter the top 10 at the 9th spot.


The US tops the FDI Confidence Index, holding its first-place position for the fourth year in a row. Global business executives are also more bullish on the US economic outlook than for any other economy. China claimed second place, also for the fourth consecutive year. However, investor expectations about the Chinese economy turned more negative this year, and executives say they will reduce their FDI in China if market volatility persists.

“The US and China have held steady at the top of the index in the face of significant changes in the global operating environment over the past four years,” said Paul Laudicina, founder of the FDI Confidence Index and chairman of AT Kearney’s Global Business Policy Council.

“Executives’ sustained interest in investing in the US and China demonstrates the undeniable and enduring attractiveness of the two largest economies in the world. Over the 18 years of this assessment we have observed consistent investor preference for large markets with robust economic prospects.”

Global executives are increasingly turning to FDI to ignite growth opportunities, despite the overall trend of slowing globalisation. Global FDI flows jumped 36% to an estimated US$1.7 trillion in 2015 - the highest level since 2007 - and the vast majority of executives also believe that FDI will become more important for corporate profitability and competitiveness in the near term. Accordingly, more than 70% of firms in the survey plan to increase their level of FDI over the next three years. A likely reason for this is the rise of protectionist sentiments in many countries - creating greater need for a local presence to do business in those markets.

Interested?

Read past editions of the FDICI

*The 2016 AT Kearney Foreign Direct Investment (FDI) Confidence Index is constructed using primary data from a proprietary survey administered to senior executives of the world’s leading corporations. The survey was conducted in January 2016.

Respondents include C-level executives and regional and business leads. All companies participating in the survey have annual revenues of US$500 million or more. The participating companies are headquartered in 27 different countries and span all sectors. The selection of countries from which to survey senior executives is based on data from the United Nations Conference on Trade and Development (UNCTAD), with the 27 countries represented in the FDI Confidence Index accounting for more than 90% of the source of global FDI flows in recent years. Service-sector firms account for 45% of respondents, while industrial firms account for about 35% and IT firms account for about 15%.

The index is calculated as a weighted average of the number of high, medium, and low responses to the questions on the likelihood of making a direct investment in a market over the next three years. Index values are based on responses only from companies headquartered in foreign markets. For example, the index value for the US was calculated without responses from US-headquartered investors. Higher Index values indicate more attractive investment targets.

FDI flow figures are the latest statistics available from the UNCTAD, and all 2015 figures are estimates. Other secondary sources include investment promotion agencies, central banks, ministries of finance and trade, and other major data sources.

13 February 2016

Consumers are now phy-gital. What should companies do?

A global, cross-industry study* from Mindtree, a digital transformation and technology services company, pinpoints personalisation as the key driver that will help "phy-gital" consumers reach their ideal mix of online and offline shopping. It also reveals that while most companies are in transformation mode and consider themselves pioneers in adopting or investing in digital technologies, few are investing in personalisation initiatives that consumers say will increase the depth and breadth of their shopping experience.

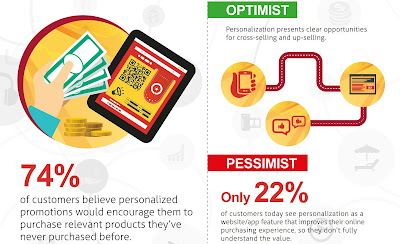
Source: Mindtree infographic. Nearly three-quarters (74%) of customers say personalised promotions will influence them to buy products for the first time.


Key findings include:
  • Personalised promotions encourage consumers to buy products and services they have purchased before (78%), as well as relevant products and services they have never purchased (74%)
  • Only 28% of the decision makers from companies surveyed globally say their organisations are investing significantly in personalisation to improve the online purchasing experience, even though it has improved their online sales over the past 12 months for the majority (58%)
  • Consumers expect their use of mobile apps for shopping to more than double in the next three years. While 6% of consumers said their preferred channel for making retail purchases as of 2015 was mobile apps, 15% said they expected mobile apps to be their preferred channel by 2018. 

The survey also highlights some notable disconnects between what online features consumers desire and what features companies are investing in. As an example, consumers crave improved search and compare/aggregate functions, but companies are investing more in features like shopping lists, wish lists and social features. 

"There are a lot of stories to be gleaned from this study, but what stands out most is that companies need to prioritise more investments in personalisation, an area that quite clearly drives more commerce," says Radha R., EVP and Head of Digital Business at Mindtree. "Many of today's personalisation approaches are ineffective since they are based on a siloed view of the customer. With the right data engine and digital underpinnings in place, customised experiences will allow companies to target the right people, at the right time, in the right place, on the right device, with the right content."

Next steps

Mindtree recommends that companies:
  • Break up data silos to get a more enriched view of customers from various digital touch points, using a big data-led approach 
  • Deliver relevance for customers by creating content, offers and recommendations using context-weighted personalisation algorithms 
  • Implement the technology to automatically deliver these customised messages and offers to customers in a cross-channel, cross-device landscape 

This will only work if a company has the right digital infrastructure at the broadest level. Mindtree believes that companies need to blend four cornerstones that are crucial to achieving true digital transformation and success: creating digital customer experiences, digitising the value chain across the front and back end, developing 'sense-and-respond' systems, and shaping new, innovative business models and partnerships.

"It's important to note that an online presence should focus on serving customers and not just on selling to customers," says Paul Gottsegen, Chief Marketing and Strategy Officer at Mindtree. "With better personalisation, companies will essentially embed themselves in the ongoing phy-gital lives of consumers and earn the right to be part of a continuous stream of engagement. It will strengthen the relationship for the long haul and give the companies that get it right a big advantage."

Interested?


*The study, Winning in the Age of Personalization, was commissioned by Mindtree and conducted by independent market research firm Vanson Bourne. It surveyed 6,000 consumers across three primary regions (US, Europe, and Asia Pacific), as well as 900 decision-makers from companies spanning the retail and consumer goods, travel and hospitality, banking and insurance, and media and entertainment industries.

5 February 2016

Disney is the world's most powerful brand: Brand Finance Global 500 2016

· Four of the 10 fastest growing brands are Chinese

· Disney is the world’s most powerful brand, thanks to Star Wars’ record-breaking success

· Despite slowing sales, Apple is the world’s most valuable brand, up 14% to US$145.9 billion

· Volkswagen brand value falls by US$12 billion following emissions scandal

· Strongest brands’ shares outperform the S&P 500 average


Brand valuation and strategy consultancy Brand Finance puts thousands of the world’s top brands to the test annually, determining which are the most powerful* and which are most valuable in its Brand Finance Global 500. For 2016:

Source: Brand Finance. The World's Most Powerful Brands, top 10.
Source: Brand Finance.

Disney in hyperdrive

Disney is the world’s most powerful brand, Brand Finance reveals, the result of acquisitions and the brands under its control. "ESPN, Pixar, the Muppets and Marvel are all now Disney owned, but perhaps its most important acquisition of all has been Lucasfilm, and thus Star Wars," Brand Finance notes.

Brand Finance has estimated the value of the Star Wars brand to be US$10 billion, buoyed by the performance of Star Wars Episode VII: The Force Awakens and Star Wars toys.

Lego loses lead

Lego has lost its position at the top of the power branding table, rocked by a fine from German regulators for attempting to prevent retailers from discounting its products. It was also accused of colluding in censorship for trying to prevent dissident Chinese artist Ai Wei Wei from using Lego in his work (Lego has since reversed its policy of restricting purchases to be used for political ends). It is currently No. 2 on the value rankings.

Source: Brand Finance. The World's Most Valuable Brands, top 10.
Source: Brand Finance.

Using its Brand Strength Index assessment, Brand Finance also determines a royalty rate for each brand, which is then applied to revenue information to calculate the brand’s value.

Apple maintains leadership

In terms of brand value, Apple is top. Brand value is up 14%, thanks to the success of the iPhone 6 and recently-released iPhone 6s. Revenue for Q4 of the fiscal year 2015 was a record-breaking US$51.5 billion with profits at US$11.1 billion while revenues for the year were US$233.7 billion. Brand Finance says that with 74.8 million handsets sold in the last quarter in a saturated market, and Apple Pay beginning to generate traction, "assertions that Apple has gone rotten are premature".

Eight of the world's top 10 most valuable brands are technology or cloud-related. Google is No. 2, Samsung is No. 3, and Amazon is No. 4. Microsoft is in No. 5 place, Verizon is No. 6, and AT&T is No. 7. The 9th and last tech brand in the table is China Mobile.

Vokswagen (VW) in reverse

VW is one of the year’s worst-performing brands, dragged down by revelations that it programmed its diesel vehicles to activate their optimal emission-reduction settings only when being tested and that, driven under normal conditions, they would emit up to 40 times the more nitrogen oxide. Brand value is down by US$12 billion, to US$18.9 billion leading to a fall in rank from 17th to 56th.

Emirates is world’s most valuable airline brand

Emirates said its brand value grew 17% over last year to reach US$ 7.7 billion, and that it has risen up the ranks for the fifth year running to be placed at No. 171, 47 places above the next closest airline brand. Emirates’ brand value has more than doubled since 2009, when it first appeared on the Brand Finance Global 500 report.

Boutros Boutros, Divisional Senior Vice President Corporate Communications, Marketing & Brand for Emirates said: “We invest strategically in building our brand and it is reflected in everything we do. We have differentiated the Emirates brand not only through our marketing and sponsorship initiatives, but also through our competitive combination of quality products and services, and technology-driven customer initiatives that our teams deliver everyday both on the ground and on board. We work hard to identify, anticipate, and meet the ever-changing needs of our diverse global audiences, as we firmly believe that this will position us to outperform in our industry now and in the future.

Brand Finance CEO David Haigh said: “Emirates continues to soar, adding 17% to its brand value this year. Brand Finance’s analysis shows that Emirates is more popular than ever– its brand equity scores for consumer factors such as familiarity, consideration, preference, satisfaction and recommendation are up across the board. Emirates’ growth this year, which builds on impressive historic trends, suggests that by 2020 it could become the first Middle Eastern brand to enter the top 100 of our ranking."

China’s fantastic growth

Four of the top ten fastest-growing brands are Chinese, Brand Finance says, highlighting WeChat and Evergrande Real Estate as two of them. WeChat's user base grew over 40% between late 2014 and late 2015 and is now over 650 million, with 70 million outside China. While it is often compared to WhatsApp, WeChat goes beyond messaging to offer videogaming and payment services. Brand value is up 83% to US$6.5 billion.

Evergrande Real Estate is the fastest growing brand this year, having added 112% to its brand value between 2015 and 2016. It is now rated No. 375 in brand value, and was not in the rankings in 2015. Brand Finance notes that the presence of a real estate brand at the top of the list could be "grist to the mill of those claiming that China’s property market is overheated and its economy as a whole set for a shock".

A number of Chinese brands have joined the most valuable brand ranking from being unplaced last year: Dalian Wanda Commercial Properties at No. 264 in value; Shenzhen Development Bank (No. 269, now called Ping An Bank), Poly Real Estate (No. 305), China Everbright Bank (No. 345), China Railway Group (No. 359, abbreviated to CREC), Air China (No. 364), China Railway Construction Corporation (no. 394, abbreviated to CRCC), Netease 163.com (No. 430), a gaming company which also provides the 163.com information portal; China Eastern Airlines (No. 464) and Hangzhou Hikvision Digital Technology, the world's largest supplier of video surveillance solutions (No. 489).

Brand Finance rankings are a better measure of future share price

In December of 2015 Brand Finance took a retrospective look at the share price of the world’s most valuable brands and the subsequent stock market performance of the businesses that own them. The findings suggest that highly branded businesses and those with strong brands can outperform the market.

Between 2007 and 2015, the average return across the S&P was 49%. However by using its data, investors could have generated returns of up to 97%, Brand Finance said. Investing in companies with a brand value to enterprise value (BV/EV) ratio of greater than 30% would have generated returns of 94%. Investing exclusively in the 10 companies with the highest BV/EV ratios would have resulted in a 97% return.

More than a hundred (115) of the top 500 brands in the 2016 list fall into the same category, Brand Finance notes. The selection includes luxury goods businesses that one might expect to be highly branded such as Burberry, Gucci and Ralph Lauren, well-known consumer brands such as Audi, Land Rover, Dove, Ikea and Nestle, but also financial and B2B brands such as Korea's Shinhan bank and Fujitsu.
Interested?

View the Brand Finance Global 500 2016

Read the WorkSmart Asia blog posts on Wanda's hotel launches in Inner Mongolia and Chengdu, China

Read the WorkSmart Asia blog posts on Emirates' expansion of flights to Istanbul, Turkey and Ningxia as well as Henan in China

Read the TechTrade Asia blog post on Netease and its vision for gaming

*Based on factors such familiarity, loyalty, promotion, marketing investment, staff satisfaction and corporate reputation. Read about the methodology

Singapore is one of Asia's most competitive talent markets

Source: Randstad Sourceright website. More than half of respondents said they are moving to an integrated talent management model.
Source: Randstad Sourceright website. Global figures.
Randstad Sourceright, a global talent player, today announced availability of its 2016 Talent Trends Report, a guide to 30 of the most important trends impacting the world of talent, employees and business this year.

The Randstad Sourceright 2016 Talent Trends Report was developed with the feedback and outlooks of nearly 400 HR, talent and business leaders spanning more than 60 countries. Randstad Sourceright uncovered that the single most challenging talent management issue of today is the lack of critical talent and the resulting impact on business, as well as a company’s leadership and succession pipeline. Other repercussions of talent scarcity include increased spending on talent acquisition, growing frustration among hiring managers and disappointed leaders who want to know why business plans aren’t moving forward.

“The Asia Pacific market faces a very uncertain 2016 with many challenges and opportunities ahead. For talent leaders, they also face a highly fluid world of work as talent scarcity grows across the region. To make sure their organisations remain agile during turbulent times, they need insight, the right strategies in place and a clear action plan,” said Doug Edmonds, Managing Director, Randstad Sourceright Asia Pacific. “Our 2016 Talent Trends Report takes an in-depth look at how leaders are responding to these developments and how best to prepare for these changes.”

Source: Randstad Sourceright website. Global figures. More than half of respondents said talent scarcity has impacted their businesses badly.
Source: Randstad Sourceright website. Global figures.

Singapore especially remains one of Asia’s most competitive talent markets. The survey discovered some revealing insights shared by Singapore-based HR leaders:

Four in 10 (41%) said they need leaders the most (enterprising, multi-skilled professionals who can lead organisational change, development, and innovation) in the next five years

Nearly seven in 10 (68%) said talent scarcity negatively impacted their business in 2015

Eight in 10 (78%) plan to improve the skills of their hiring managers to provide a better candidate experience

The following areas that needs more investment to support their business goals, say Singapore HR leaders:
  • More market intelligence (61%) 
  • Investment in business and HR analytics (59%) 
  • Investment in specialised recruiting and sourcing operations for specific skill-sets (54%) 

The survey results presented in the report also provide a holistic view of how organisations around the world deploy talent, the challenges they face and the solutions that help them to keep moving forward. Key findings include:

85% of respondents believe an integrated talent management approach encompassing permanent and contingent talent will enhance the resources available for business growth.

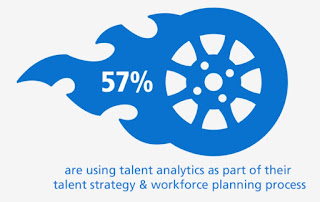
  Source: Randstad Sourceright website. Global figures. Nearly six in 10 of respondents are using talent analytics.
Source: Randstad Sourceright website. Global figures.

The use of talent and workforce analytics continues to increase, with 73% in Singapore using this data to create more efficient workforce planning.

When asked about the biggest trends impacting the future of work in the next five to 10 years, the top responses were the need to create greater flexible working options to attract mobile talent, the ability to analyse internal and external employee data to source and retain talent and the challenge of keeping pace with evolving technology. 

Interested?

Download a complimentary copy of Randstad Sourceright 2016 Talent Trends Report. Infographics are available on the same page. 

6 January 2016

Employees prefer recognition to money

Donut chart showing the different influences of corporate behaviour, with 'tone at the top' taking up the lion's share of the chart.
Source: ACCA report. Tone at the top influences corporate behaviour the most, according to 61% of respondents.

A new report, Culture and channelling corporate behaviour: ACCA member survey, published by ACCA (the Association of Chartered Certified Accountants) has found that recognition at work is the highest motivator, regardless of age, industry or location – even outstripping monetary reward.

The survey, which was co-funded by the ESRC (Economic and Social Research Council), harnessed the views of almost 2,000 ACCA finance professionals from across the globe. The results also highlighted geographical variations, including the desire to reach a more senior position as being a stronger motivator in Africa and Asia while having a more challenging role was most important for employees in the Americas.

Jo Iwasaki, ACCA Head of Corporate Governance, said: “The survey highlighted some clear distinctions between employee views in Europe and America and Africa and Asia. For example in Africa and Asia rules and procedures play a larger role than for respondents in Europe. However, the tone of corporate leadership is vitally important in channelling the overall culture of an organisation in any region.”

The issue of performance management will be of particular interest to business leaders. Although half of the respondents conceded that performance-related pay schemes could help foster best performance, nearly two-third thought that such systems may invite people to exaggerate or otherwise falsify their measures. This shows the fine line employers need to tread when putting in place performance related targets and the need for careful consideration when linking them to pay.

Konstantinos Stathopoulos, Professor of Accounting and Finance at Manchester Business School and co-author of the report, said: “The survey results reveal there is no 'one size fits all' strategy when it comes to building corporate culture and behaviour. Even though the role of leadership in setting the tone is highlighted in most responses, the survey uncovers significant differences in attitudes and perceptions regarding effective channels of corporate behaviour. These disparities are also intensified by differences in respondents’ geographic location, industry and characteristics.”

Interested?

Read the report

21 December 2015

Bath and shower products go organic

Consumers are looking for organic ingredients and convenience when it comes to bath and shower products, says research firm Technavio. The rise in living standards and income are also leading consumers to opt for more expensive and aesthetically appealing bath and shower products with different fragrances and effective ingredients, the company said in a report on the global bath and shower products market that forecasts a market worth at least US$15 billion by 2019, a CAGR of around 4% between 2015 and 2019. 

“The market is witnessing increase in demand for organic products like organic shampoos, conditioners, and soaps due to the rising issues of hair- and scalp-related problems. Manufacturers have recently developed organic dry shampoos such as Estée Lauder’s Ojon and Pierre Fabre's Klorane, which absorb dirt and oil on the hair and scalp. These shampoos retain the natural hair oils and saves time and effort on the part of consumers as there are convenient to use,” says Brijesh Kumar Chaubey, Lead Analyst, Consumer & Retail, Technavio Research.

Shower products - shower gels, shower creams, exfoliates, body shampoos, mousses, loofahs, bath brushes, body polishers, and foot scrubs - lead the market, accounting for 70% of overall market share. The report predicts this segment to retain its leadership until the end of 2019, growing at a rate of around 4%. 

Key vendors dominating the global bath and shower products market include Johnson & Johnson, L'Oreal, P&G, Unilever and Colgate-Palmolive. According to Technavio competition in the market is expected to intensify during the forecast period, with an increase in product/service extensions, innovations in technology, and mergers. 

Interested?

14 December 2015

PwC upbeat about digital entertainment and media, traditional media resilience

Global entertainment and media outlook 2015 to 2019 presented in categories
Source: PwC website.

PwC Middle East has launched Middle East and Africa insights from PwC’s 16th annual edition of the Global Entertainment & Media Outlook 2015-2019* (Outlook) at the Dubai Film Market on December 10, 2015.

According to the Outlook, the rise of mobile Internet is an important opportunity for data-driven advertising. Mobile Internet subscribers in the Middle East and Africa are expected to grow at a CAGR of 21.9% to 2019, and global smartphone connections are forecast to double from 1.92 billion in 2014 to 3.85 billion in 2019 (half the world’s population). PwC forecasts that the global mobile Internet advertising spend will be second only to search spend, surpassing display by 2018, growing at a CAGR of 23.1%.

In the Middle East and Africa, entertainment and media spend will increase from US$38.8 million in 2014 to US$61.1 million in 2019. Consumers now want flexible, on-demand TV and film viewing across platforms, with over the top (OTT)/streaming reaching US$19.2 billion globally by 2019.

In the Middle East, Saudi Arabia is expected to have the highest film market revenue growth (albeit from a low base) at a CAGR of 18.5% from 2014-2019, driven by OTT/streaming and because there is no cinema sector in the country. In the UAE, popular TV and film intellectual property (IP) is going omnichannel. It is being integrated beyond the big screen into leisure attractions, including several upcoming theme parks. The UAE has a relatively large filmed entertainment industry for the region, expected to reach US$141.9 million by 2019.

Philip Shepherd, PwC Middle East’s Entertainment and Media Partner said: “With the availability of all digital resources at our fingertips, consumers will choose the most convenient, flexible and fastest methods to connect digitally.”

Jayant Bhargava, Middle East Digital Media and Entertainment Partner with Strategy& (formerly Booz & Company) said: “Time spent with media and video viewing is at an all-time high. Proliferation of devices and connectivity is driving a culture of media snacking and multitasking. Today, consumers have access to a wide range of content and a multitude choice of how and when to view it. This is driving an explosion in video content and new genres are being introduced by emerging artists world over.”

Globally, worldwide entertainment and media revenues will rise at a CAGR of 5.1% over the coming five years, from US$1.74 trillion in 2014 to US$2.23 trillion in 2019, PwC said.
Global highlights include:
The content experience trumps delivery platforms

PwC notes that consumers disregard distinctions between ‘digital’ and ‘non-digital’, instead exploiting the digital medium in what, when and how they consume. "In making these choices, they’re migrating to offerings that combine relevance and convenience - attractive content, easy discovery, social community - with an inspiring, personalised experience, however it’s delivered," the company noted.

As a result, non-digital media will still contribute well over 80% of global consumer revenues in 2019. Spending on live music ticket sales and cinema box office will rise at a combined global CAGR of 4.7% to 2019, outpacing overall consumer spending at 2.9%. In China, box office revenues will rise at a CAGR of 15.5%.

Marcel Fenez, PwC’s Global leader, entertainment and media, comments: "Digital or non-digital - for consumers it’s all about content experiences. Given the wide variations in consumer preferences, the challenge for entertainment and media companies is to blend data insights and consumer intuition to maximise the value of the experiences they offer. The prize for achieving this is heightened by the fact that the consumer has never been more up for grabs than today."
Advertising growth is primarily digital

Turning to advertising, total global advertising revenues will rise at a CAGR of 4.7% to 2019. Again there will be wide variations by territory, with Indonesia the fastest-growing ad market at a CAGR of 12.9% to 2019. Like consumer revenues, advertising will see digital growth and non-digital resilience: while global digital advertising revenue will rise at a 12.2% CAGR against just 1.2% for non-digital advertising, non-digital will still contribute over 60% of global ad spend in 2019.

The direction is toward digital, however. By 2019, digital advertising as a whole - including digital out-of-home - will account for 38.7% of total global advertising revenue, up from just 16.6% in 2010. Mobile Internet advertising will surge at a 23.1% CAGR to 2019, and video advertising spend globally will rise at a CAGR of 19.5%, supported by a near-doubling of global smartphone connections to 3.85 billion in 2019.

Alongside Internet advertising, digital out-of-home advertising (DOOH) will be another high-growth area, with revenues rising at a 13.2% CAGR. Given the high costs of upgrading OOH to digital formats, the most lucrative markets for DOOH advertising will be major cities. By 2019, Singapore will see DOOH advertising account for 60.4% of total OOH advertising revenue.

Consumers migrate to new media consumption behaviours

Underlying the trends in entertainment and media spending detailed in the Outlook is the migration by consumers worldwide to new ways of consuming content. One of the clearest shifts is in TV and video consumption, with consumers increasingly demanding high-quality original programming in a flexible, on-demand manner across numerous devices - thus enabling ‘binge viewing’ and greater convenience. OTT services offer the best outlet for this type of consumption.

A further shift toward social/casual gaming is underway, spending on which will exceed traditional gaming in nine markets by 2019, including India. While territories with long-established console and PC game markets continue to be dominated by traditional gaming revenue, the global growth of social/casual gaming will create a US$22.52 billion market by the end of the forecast period.

Newspaper consumption is also changing, with consumers increasingly willing to pay for premium content. Online paywalls are now making up for newspapers’ lost print circulation revenues globally, with a wave of subscription offerings boosting newspapers’ digital circulation revenues to nearly US$2.5 billion in 2014. In aggregate, as digital subscription revenues gain momentum globally and print subscriptions continue to shrink, total global newspaper circulation revenue is set to record year-on-year increases - a pattern that began in 2013.
*PwC’s 16th annual update of the Global Entertainment & Media Outlook 2015-2019 (Outlook) provides a single comparable source of five-year forecast and five-year historic consumer and advertiser spending data and commentary, for 13 entertainment and media segments, across 54 countries. Segments covered by the Outlook include TV subscriptions and licence fees, TV advertising, Internet access, radio, Out-of-home advertising, Video games, Filmed entertainment, newspaper publishing, Magazine publishing, Business-to-business, Internet advertising, book publishing and Music. Information may not align with the online version as the data is constantly updated. Refer to the online Outlook as the most up-to-date source of consumer and advertising spend data.

4 December 2015

KPMG sees holes in global corporate responsibility reports

Carbon reporting from the world's largest companies lacks consistency, making it almost impossible for stakeholders to compare one company's performance easily and accurately with another's, according to the 2015 edition of the KPMG Survey of Corporate Responsibility Reporting*.

Professionals at KPMG member firms reviewed the carbon information published by the world's largest 250 companies in annual financial and corporate responsibility reports. They found that although four out of five of the companies discuss carbon in these reports, the type and quality of information published varies dramatically. For example, only half the G250 (53%) state carbon reduction targets in their company reports and, of these, two thirds provide no rationale to explain why those targets were selected.

The type of emissions reported also varies considerably, KPMG said. While a majority of reporting companies report on emissions from their own operations (84%) and from purchased power (79%), only half report on emissions in their supply chains. Even fewer, less than one in ten (7%), includes information on emissions resulting from the use and disposal of their products and services.

Around half (51%) of the companies that do discuss carbon in their company reports refer readers to further detailed information in alternative sources such as the CDP database** for investors. The other half does not.

Wim Bartels, a partner with KPMG in the Netherlands and KPMG's Global Head of Sustainability Reporting & Assurance, is the lead author of KPMG's survey. He said: "All stakeholders should be able to access good quality, comparable information on a company's carbon performance quickly and easily from the company's annual financial or corporate responsibility reports. That is simply not the case today.

"There is a clear need for improvement and global reporting guidelines on carbon could help to address this problem. It should not be left to companies alone to figure this out; industry bodies, regulators, standard setters, investors and others all have a role to play."

KPMG's study follows a recent proposal to the G20 by the Financial Stability Board for a task force to develop consistent climate-related disclosures for companies to help lenders, insurers, investors and other stakeholders to understand material risks1. The Climate Standards Disclosure Board (CDSB) has also introduced a voluntary framework aimed at helping companies include investor-relevant climate information in mainstream financial reporting2.

The KPMG study includes guidelines on data, targets and communication that KPMG member firms believe companies should follow when publishing carbon information in annual financial and corporate responsibility reports.

KPMG's researchers devised a scoring methodology based on these guidelines which they used to assess the quality of reporting from each of the 250 largest companies. Key findings include:
  • One in five large companies in high carbon sectors such as mining, construction and chemicals does not report on carbon in its annual financial or corporate responsibility reports
  • European companies have a higher quality of reporting than companies elsewhere in the world
  • Companies in the transport & leisure sector produce the highest quality reporting by sector, and oil & gas companies the lowest
  • Only half the companies that report on carbon in their annual financial or corporate responsibility reports explain how cutting carbon benefits their business

The KPMG Survey of Corporate Responsibility Reporting includes a view of global trends in corporate responsibility (CR) reporting based on analyses of reports from 4,500 companies across 45 countries. It shows that the rate of CR reporting is now higher in Asia Pacific than it is in Europe or the Americas. Nearly eight in 10 (79%) companies in Asia Pacific report on CR.

The highest rates of CR reporting are now found in emerging economies such as India, Indonesia, Malaysia and South Africa. These high rates are often driven by regulation, either from governments or stock exchanges.

The research also shows that it is now standard business practice to include CR information in the annual financial report – more than half (56%) of the 4,500 companies studied do this.

Interested?

Download the report

*The KPMG Survey of Corporate Responsibility Reporting is now in its 9th edition and was first published in 1993. Research is carried out by professionals in KPMG member firms and is based on publicly available information published by companies in their corporate responsibility reports, annual financial reports and websites.

In the 2015 edition, the sample of the world's 250 largest companies is based on the 2014 Fortune 500 listing3. Global trends in CR reporting are based on a study of reporting from the top 100 companies by revenue in each of the 45 countries.

**The CDP database is the largest collection globally of self-reported climate change, water and forest-risk data.
1 Source: http://www.financialstabilityboard.org/wp-content/uploads/Disclosure-task-force-on-climate-related-risks.pdf Retrieved 17 November 2015
2 http://www.cdsb.net/what-we-do/reporting-frameworks/climate-change Retrieved 19 November 2015
3 http://fortune.com/global500/2014/

12 November 2015

Smaato highlights key role of emerging markets in mobile advertising

Source: Smaato.

Smaato, the global real-time advertising platform for mobile publishers and app developers, has released its Q315 Global Trends in Mobile Programmatic Report. Smaato analysed data from billions of mobile ad impressions served on its exchange during the third quarter of 2015 to reveal massive growth in Asia Pacific. Indonesia grew by 84% in the third quarter, outlining the next frontier of mobile advertising for publishers and advertisers in Asia Pacific.

While the strongest regions on the Smaato platform remain those with highly-developed mobile, advertising and commerce infrastructures and those with large populations and a mobile-first mentality such as India, Asia Pacific is new to the list of leading regions. This comes as a result of rapidly developing mobile networks and a proliferation of smartphones, which have combined to create a wealth of opportunities for mobile publishers and advertisers on the Smaato platform.

“As the world gets more connected, it’s never been more crucial to go global with your mobile advertising strategy,” said Ragnar Kruse, CEO and co-founder of Smaato. “India, with its massive, mobile-first population, has long been considered the ‘next big market.’ While India remains a growing powerhouse, our data also shows that countries like Indonesia and Brazil are up-and-coming markets in Latin America and Asia Pacific - and offer incredible opportunities for publishers to monetise, and for advertisers to connect with consumers.”

This past quarter, Smaato found a subtle year-over-year shift in Q3 away from the mobile web in favour of apps. This shift could come as a result of publishers directing users to apps to avoid ad-blocking software, which is primarily a mobile web issue. Additional findings in the report include:

The operating system with the strongest growth continues to be Android, with supply and spending soaring by 67% during Q315 from the year before.

Larger ad formats result in higher eCPM (cost per 1,000 clicks). While traditional banners (320x50) are still growing, their rate of growth is dropping in favor of larger sizes like the medium rectangle (300x250) - up 85% - and the interstitial ad (320x480) - which grew 77%.

Rich media continues to generate higher and higher revenues for publishers and app developers - now generating 116% higher revenues than image-based ads.

Smaato serves up to 6 billion ads each day, across 800 million unique monthly mobile users around the world, and works with 90,000 mobile app developers and publishers. The Global Trends in Mobile Programmatic Report reflects the detailed activity and trends that have developed over the third quarter of 2015 across Smaato’s broad, global base of publishers, advertisers and users.

Interested?

Download the report

19 October 2015

Singapore's CPF retirement savings systems slips in the MMGPI rankings

A slight drop in the index value of Singapore’s retirement savings system, the Central Provident Fund (CPF), has seen it slip from a B grade to C+ grade in the 2015 Melbourne Mercer Global Pension Index (MMGPI). Singapore’s overall score decreased from 65.9 in 2014 to 64.7 in 2015, moving it further away from an ‘A’ grade, which is given to pension systems that score above 80. Denmark and Netherlands are the only countries to achieve an A grade in the history of the index.

The drop in Singapore’s score is attributable to:

1) A change in calculation which reduced the level of pension assets as a percentage of GDP for Singapore. This calculation represents the amount of money set aside for retirement;

2) Most recent data from the Economic Intelligence Unit showing a decrease in the net household savings rate for Singapore;

3) The United Nations’ updated life expectancy figures in its World Population Prospects: The 2015 Revision report, showed a continued decline in mortality rates for Singapore.

“While Singapore’s retirement income system remains amongst the best in Asia, we are not the best globally. Improvement will be influenced by the legislative and regulatory environment,” said Neil Narale, Asia Retirement Leader for Mercer.

“However, Singapore is on the right track, having announced improvements to CPF in 2016, including increasing the wage limit, contributions and guaranteed investment returns for older members and introduction of the Silver Support Scheme to help low income retirees."

Now in its seventh year, the MMGPI measured 25 retirement income systems against more than 40 indicators under the sub-indices of adequacy, sustainability and integrity. The MMGPI is the world’s most comprehensive comparison of pension systems. It covers close to 60% of the world’s population and suggests how governments can provide adequate and sustainable benefits that protect their citizens against longevity risk, the risk of their ageing population outliving their savings, potentially one of the biggest economic and social risks facing many retirees today.

Author of the report and Senior Partner at Mercer Dr David Knox said, “Implementing the right reform to improve pension systems and provide financial security in retirement has never been more critical for both individuals and societies.

“The MMGPI is an important reference for policy makers around the world to learn from the most adequate and sustainable systems. We know there is no perfect system that can be applied universally, but there are many common features that can be shared for better outcomes.”

The 2015 MMGPI looked beyond the annual rankings to observe changes over the last seven years and assess which pension systems will continue to deliver and which ones are at risk.

“Our seven-year snapshot highlights the importance of measures such as adjusting the state pension age, increasing workforce participation amongst our ageing population, or funding additional contributions for future retirement income,” said Dr Knox.

All of the 11 countries that have been part of the MMGPI since it began in 2009 have experienced an increase in the expected length of retirement from 2009 to 2015, with the average length rising from 16.6 years to 18.4 years.

Five countries – Australia, Germany, Japan, Singapore and the UK – have increased their pension age to offset the increase in life expectancies, but these are not enough to halt the increasing length of retirement.

The Index also looks at the average expected length of retirement in 20 years, and by this measure, three countries have witnessed a reduction. For Canada and the Netherlands this is due to a projected increase in the state pension age from 65 to 67 during the 20 years, while for the US, life expectancy has reduced slightly. The other eight countries showed an increase.

For the 16 countries that have been part of the MMGPI since the 2011 report, the average labour force participation rate for 55 to 64 year olds has increased from 57.9% to 62.2% between 2011 and 2015, or just over 1% per year.

However, averages can be misleading. The labour force participation rate at older ages actually went backwards in the US. In Brazil, India and China, it increased by less than 4%.

“Extending the years that individuals spend in the workforce is one of the most positive ways of developing sustainable retirement systems when life expectancies are increasing,” Dr Knox said.

“While there is a natural limit to the participation rate at older ages, with most countries still below 70%, the scope for significant increases across the world remains, which would improve the sustainability of many pension systems.”

The sustainability of a pension fund cannot be assessed without reviewing the level of funds set aside today to pay future retirement benefits so that the expected pension are not a financial strain on the next generation.

There is an enormous variety in the level of pension assets held ranging from 1.8% of GDP in Indonesia and 6% of GDP in Austria to 160.6% of GDP in the Netherlands and 168.9% of GDP in Denmark.

“The diversity in pension assets held as a percentage of GDP recognises that some countries have very limited private pension arrangements whereas others have well-developed and mature pension systems. However, it is an important warning for all countries to prepare, prepare, prepare,” said Dr Knox.

The MMGPI notes that there is room for improvement in all countries’ retirement income systems. Suggested measures to improve Singapore’s system include:

· Reducing the barriers to establishing tax-approved group corporate retirement plans;

· Opening CPF to non-residents (who comprise more than one-third of the labour force);

· Increasing the labour force participation rate amongst older workers.

“Employers continue to be interested in either sponsoring a corporate retirement plan, or privately managing parts of the CPF investments. Policies that include employer participation would further increase Singapore’s grade in the future,” said Narale.

The Index looks objectively at both the publicly-funded and private components of a system, as well as personal assets and savings outside the pension system. It is published by the Australian Centre for Financial Studies (ACFS) in conjunction with Mercer and is funded by the Victorian State government of Australia. 

Interested?

10 June 2015

Instant coffees gain traction


The reputation of instant coffee has improved among consumers, especially youth, as it is less expensive and easy to prepare, boosting the outlook for instant coffee globally, says research firm Technavio. The company has published a new report on the global instant coffee market.

The number of coffee drinkers has increased, as has the acceptance of café culture globally, prompting coffee producers to introduce new varieties in the market, Technavio adds. Price fluctuations for green coffee beans add an element of volatility however.

“The growing trend of having coffee during casual social conversations, particularly in developing economies where the young population is high, is bolstering the market for coffee vendors globally,” says Faisal Ghaus, Vice President of Technavio.

“With the rise in coffee drinkers spurred by the increase in number of visitors to coffee shops and cafés, the potential customer base for instant coffee has expanded.”

Interested?

9 June 2015

Singapore-based eBay sellers reach an average of 41 international markets

Source: eBay report.

eBay today announced details of the growing successes for Singaporean businesses via its online marketplaces, which has been experiencing solid growth on the back of a revitalised US dollar.

Singapore’s retail exporters* sell to an average 41 international markets – ranked second in Southeast Asia behind Thailand and five destinations higher than US retail exporters.

“The US is the top trade corridor for Singaporean retail exporters and the strengthening US dollar has been a key driver of growth,” said Jason Lee, Director, eBay South East Asia.

An exciting trend for Singapore businesses seeking new revenue streams is the speed in which entrepreneurs are able to become a retail exporter, with 22% of Singaporean retail exporters on eBay hitting the US$10,000 sales mark in the past year alone.

“This demonstrates the huge opportunity for savvy entrepreneurs seeking a global customer base as compared to traditional exports, which has typically been limited to larger businesses,” said Lee. “We are seeing an increasing number of success stories from Singapore – SMEs selling on eBay’s US, UK, Australia and other global marketplaces.

“SMEs form the backbone of Singapore’s economy, and eBay aims to help local SMEs and entrepreneurs by providing them with a platform where they can not only have a local presence but more importantly, deliver goods and services on an unprecedented global scale. This is very much in line with the government’s emphasis on innovation and internationalisation, which is central to economic restructuring.”

In traditional commerce, many companies of all sizes have limited exposure to international markets. Commerce platforms like eBay allow entrepreneurs, including small retailers, to reach global markets directly in a way that is unprecedented in economic history.

In 2007, Gift of Time, a local premium watch retailer, began selling on eBay. Since then, the retailer’s business has expanded significantly, from one employee in Singapore to 16 staff selling watches around the world, including the US, UK, Germany, Australia, Russia, Brazil and China.

Jeson Wu, Founder, Gift of Time commented: “We have grown much faster than any of the Singapore watch retailers here, because of one simple reason – we decided to go online. Today, more people are using their computers and mobile devices to browse and shop online, so you need to make sure that your business is where the customers are going. Our presence on a credible platform like eBay also allowed us, a lesser established local merchant, to connect with and gain trust among foreign customers."

“Since entry barriers for Internet-enabled trade are lower, it is easier for newcomers to enter the market and for commerce enabling platforms such as eBay to have a pro-competitive effect. We have been working closely with the Economic Development Board (EDB), SPRING Singapore and the Infocomm Development Authority of Singapore (IDA) to help SMEs in Singapore further expand retail exports,” added Lee.

According to eBay:

· Southeast Asian regional retail exporters reach an average of 33 international markets, more than other regional blocs such as NAFTA with an average of 27, and EU28 with an average of 17.

· The US, UK, Australia, Germany and Canada are the top five destinations for eBay retail exporters from Singapore; whereas in traditional (offline) commerce, major export destinations are Malaysia, mainland China, Hong Kong, Indonesia and the US.

· The main products sold by eBay commercial sellers from Singapore are in the ‘Jewellery and Watches,’ ‘Cell Phones & Accessories’ and ‘Clothes, Shoes & Accessories’ categories.

These and other findings were recently issued in an eBay report, Commerce 3.0: Enabling ASEAN SMEs. The analysis in the report is based on research by Sidley Austin on datasets from eBay, and follows research conducted in the Asia Pacific, US and Europe.

Interested?

Find out more about Commerce 3.0: Enabling ASEAN SMEs
 
*Singapore retail exporters are defined as eBay sellers in Singapore who have accumulated US$10,000 in sales to global customers (buyers outside of Singapore).

4 June 2015

Apple recalling Beats speakers, giving refunds

Apple yesterday announced a voluntary recall of Beats Pill XL speakers, including a refund for customers. Apple has determined that, in rare cases, the battery in the Beats Pill XL may overheat and pose a fire safety risk, the company said.

The recall does not affect any other Beats or Apple products, and only applies to the Beats speaker pictured below.


"Because customer safety is the company’s top priority, Apple is asking customers to stop using their Beats Pill XL speakers," Apple said in a statement on its website.

Beats Pill XL speaker owners should visit www.apple.com/support/beats-pillxl-recall for details about how to return their product to Apple, and how to receive an Apple Store credit or electronic payment of US$325, or equivalent in local currency. The recall is only done through the Web, and owners can choose their country through a drop-down menu on the left of the screen.

The Beats Pill XL was introduced by Beats by Dre in November 2013. Apple acquired Beats in 2014. The Beats Pill XL can be identified by the Beats “b” logo on the speaker grille and the words “beats pill XL” on the handle.

posted from Bloggeroid

29 May 2015

Home treatments for teeth whitening grow in popularity

Technavio, a tech-focused research firm, has observed that self-applied teeth whitening products have revolutionised global oral care, with consumers preferring home instead of professional treatments. Oral care products like dental strips, whitening pens, and trays have replaced professional whitening treatments because of their cost and ease of use, the research firm said.

In a new report on the global teeth whitening products, the company said the market is expected to grow at a CAGR of almost 4% from 2015 to 2019. "Thanks to advances in teeth whitening, vendors are introducing new sustainable products with better offerings into the market. These products are considered highly cost effective and have witnessed impressive growth in countries like the US and India,” says Faisal Ghaus, Vice President of Technavio. 

“Though over the counter teeth whitening products are less effective than professional treatments, these products are popular as they are not time consuming. Vendors are expected to introduce more whitening products as value-added offerings and contribute to the growth of this market during the forecast period.”

27 May 2015

We're all washing our hair more often

A rapid increase in hair-related problems and pollution have prompted people to start shampooing their hair on alternate days or daily, increasing the overall frequency of shampoo usage and boosting the shampoo industry. This observation, from Technavio;'s report on the global hair shampoo market 2015-2019 global hair care market, explains why shampoos accounted for more than 40% share of the global hair care market in 2014, the research firm said. 

Source: Technavio.
The global shampoo market is expected to grow at a CAGR of 4.69% during the forecast period of 2014 to 2019, driven not only by an increase in the frequency of shampoo usage but also more customised products, higher demand for anti-dandruff shampoo, and more interest from developing countries. 

“Companies have now begun to develop safer and more effective products made from natural ingredients. For instance, Unilever has a natural professional hair shampoo product line under the brand name Suave,” says Faisal Ghaus, Vice President of Technavio.

“Clairol Herbal Essences has also launched the Naked Line range that uses no heavy residues, parabens or dyes.”

Trends to watch for over the forecast period include rising demand for organic shampoos, dry shampoo and professional shampoo as popular categories, and also more men taking an interest in shampoo.

Key vendors mentioned in the report include Henkel, Kao, L'Oréal, P&G and Unilever.

Interested?

Find out more about the Global Hair Shampoo Market 2015-2019.

4 April 2015

Facebook took majority of social network ad spend in 2014

Ad spend on social networks grew 41% globally in 2014, totalling over US$15.3 billion and accounting for 11% of global digital ad spend, said Strategy Analytics in a Global Social Network Forecast. Facebook accounted for three-quarters of global social network ad spend in 2014, while Twitter accounted for 8%. In 2015, ad spend on social networks is expected to grow by 29%, amounting to an estimated US$24.2 billion.

"Overall, the social network market continues to show strong growth across all regions as the major social network platforms drive usage and engagement via improved integration of digital media content," said Leika Kawasaki, author of the report. "While Facebook currently dominates the global social network market, its absence in China allows local social networks such as QZone and Tencent Weibo to gain traction in the rapidly expanding Chinese digital advertising market."

The social network population passed the 2 billion mark in 2014, with nearly half (46%) of social network users residing in the Asia Pacific region. Of this 2 billion, 68% are Facebook users, the company said. Other findings include:
  • China accounts for almost 25% of the global social network population, with 495 million users in 2014. 
  • China is the third-largest geography for global social network ad spend with 8% of the share, behind the US (41%), and then the UK (8.2%). 
  • In 2015 social network users will grow to 2.2 billion, or 31% of the global population. By year-end 2019 the company expects social network users to reach 2.72 billion and account for 36% of the population.

Click here for the report. 

16 January 2015

Top 10 global consumer trends for 2015 deal with multitasking and sharing

Source: Euromonitor.
The top 10 global consumer trends for 2015 have been unveiled today by market research company Euromonitor International.

According to Euromonitor’s Top 10 Global Consumer Trends 2015 report, consumers are time-poor, seek convenience, greater choice, global availability and instant gratification. What they want is to maximise their time and money by finding products and services that combine multiple needs. 
For example, a Swedish taxi company offers in-car therapists, priced at US$165 per hour, for their stressed and time-pressed users.

“Post-recessionary consumers are prepared to pay for products that simplify their hectic on-the-go lives,” said the report’s author and Euromonitor Consumer Trends Consultant, Daphne Kasriel-Alexander. “Technology plays a big part in attaining convenience, and omnichannel shopping options creates a seamless link between virtual and 'real world' shops with wide consumer appeal.”

According to the report, this year will also see a rise in collaborative consumption and a culture of sharing products and services, something mainstream brands are already reacting to. For example, clothing brand Patagonia has partnered with eBay to redistribute pre-owned items. The sharing mindset has given rise to a plethora of collaborative endeavours from community gardening, to grouped workspaces, and sharing via crowdfunding.

“In 2015, the sharing economy is growing and disrupting the way in which individuals think of space and ownership. Consumers are increasingly preoccupied with access to goods rather than owning them outright,” said Kasriel-Alexander.

The Top Global Consumer Trends of 2015:


  • Buying Convenience
  • Malls and Shopping Centres in Community Mode
  • Privacy Matters
  • Consumption as a Route to Progress
  • Influencers: More Like Us
  • Let’s Share: The Rise and Rise of Lightweight Living
  • Millennials
  • Shopping the World
  • Virtual to Real and Back: A Smoother Convergence
  • Wired and Well: Connected Health
Read the report here

15 January 2015

Hilton customers to benefit from Live Nation experiences

Hilton Worldwide's new five-year marketing partnership with Live Nation, a live entertainment provider, will see members of Hilton HHonors, Hilton’s 42-million-member-strong guest loyalty programme, guests and team members across over 4,250 hotels worldwide to enjoy unique experiences such as artist connections and concerts. 

Source: Hilton Worldwide. Hilton
is setting out to inspire a new,
healthier mindset - encouraging
 people to seek out the unfamiliar,
to appreciate a different point of
view and to learn from every day
experiences and travel moments.
Hilton at Play, a global campaign to connect people with enriching and playful experiences, will be anchored by Live Nation, while Hilton will become Live Nation's Official Hotel Partner. The two companies are scheduling play dates with award-winning artists at Hilton locations throughout the world. In addition, Hilton HHonors members will be invited to redeem HHonors points and bid on exclusive play experiences such as sound checks and ’meet & greets’ with popular artists.

“Around the world, people simply are not taking time off from work to play... Hilton at Play is our response: it’s a cultural catalyst for change and a reminder of the power of travel,” said Jeff Diskin, Executive VP, commercial services, Hilton Worldwide.