Showing posts with label research. Show all posts

5 September 2024

Savills: Dubai is the No. 1 destination for executive nomads

The UAE has taken the top two spots in the Savills Executive Nomad Index this year. Dubai has retained its lead position for the 2nd consecutive year, while UAE capital Abu Dhabi moved from 4th place to 2nd this year. 

The Savills Executive Nomad Index ranks 25 destinations for long-term remote workers. All either have a digital nomad visa programme, or equivalent, or in the case of the US and European countries, are already part of a large economic bloc that allows free movement of people for living or work. 

They offer favourable climates year-round, a high quality of life and have established prime residential markets. Both Dubai and Abu Dhabi rank highly in several categories; however, Dubai has a large advantage in air connectivity, which places it ahead of Abu Dhabi overall. 

Dubai International, its main airport, is the world’s busiest for international passenger traffic. The recently announced Al Makhtoum airport expansion in Dubai will make it the largest airport in the world upon completion. 

“Dubai and Abu Dhabi are incredibly appealing to executive nomads, because they offer everything you need to thrive both personally and professionally, from modern infrastructure to high quality of life,” said Andrew Cummings, Head of Residential Agency - Middle East at Savills. 

“We’ve seen a real focus on creating a lively business environment where there are plenty of opportunities to grow, build networks and make lifelong connections.”

Source: Savills. Chart: the Savills Executive Nomad Index 2024 includes Dubai, Abu Dhabi and Bali as destinations.
Source: Savills. The Savills Executive Nomad Index 2024 includes Dubai, Abu Dhabi and Bali as destinations.

“The more common digital nomad is symbolised by the young backpacker; however, executive nomads tend to be older and more likely travel with family in tow,” said Kelcie Sellers, Associate Director, Savills World Research. 

“This places a greater emphasis on the quality of life aspects that these top international locations can provide, such as safety and access to healthcare or education facilities. For these individuals, both physical networking and digital connectivity are important and must be accounted for. 

“Executive nomads are more likely to rent, and put an emphasis on extra space and proximity to local amenities. Prime rents have risen, on average, by 5% in the last year across the 25 locations monitored in the Savills index, with some urban markets seeing increases of more than 15%.” 

Also new to the 2024 Index is Bali in 12th place, the 1st and only Southeast Asian city in the index.

3 April 2018

TrustYou lists the best hotels in SEA

TrustYou, the guest feedback platform, has published its research* on the best hotels in Southeast Asia. 

Leading the pack out of 11 properties in Singapore is Naumi Hotel Singapore, followed by Oasia Hotel Novena by Far East Hospitality, Hotel Jen Orchardgateway Singapore, The Ritz - Carlton Millenia Singapore and Conrad Centennial Singapore.

The March 2018 list of best-rated luxury hotels from TrustYou, covering Singapore, Vietnam, Thailand, Malaysia, Indonesia, Cambodia, Laos and the Philippines, lists The Westin Langkawi in Malaysia as the top hotel among the countries surveyed, followed in No. 2, No. 3 and No. 4 place by Thai hotels: the JW Marriott Phuket, the Hansar Bangkok, and the Renaissance Phuket. The New World Manila, Philippines, is in No. 5 place, followed by sixth-ranked Grand Hyatt Jakarta. The Naumi Singapore, the InterContinental Kuala Lumpur in Malaysia, the Sofitel Krabi Phokeethra Golf & Spa Resort in Thailand, and the Oasia Hotel Novena Singapore round out the top 10.

The three best-rated hotels in Vietnam are:
For Cambodia, they are:
There is one entry for Laos, the Luang Say Residence. For the Philippines, Solaire Resort & Casino is ranked No. 2, and the Monaco Suites de Boracay is ranked 3rd. In Indonesia, the Mulia Villas in Bali is ranked No. 2, while the JW Marriott Hotel Jakarta is No. 3. In Malaysia, the JW Marriott Kuala Lumpur is in third place. 

These aggregated results are drawn from TrustYou’s keyword analysis of travel reviews associated with hotels, destinations and travel websites scattered across the vast and fragmented market. The company draws its data from over 230,000 travel reviews a month from various sources and transforms this content into actionable insights and visualisations for over half a million hotels.

*A hotel is defined as luxury hotel if it gets a certain amount of keywords such as "luxury" and "luxurious" in their reviews that TrustYou analyses. The company looks at reviews, popularity within the same city, and popularity globally.

8 March 2018

Food&HotelAsia offers report on industry innovations to pregistered delegates

Food&HotelAsia (FHA) has launched a white paper in collaboration with Euromonitor International to celebrate the event’s 40th anniversary.

Smart Innovations Transforming the Food and Hospitality Landscape by 2020 is a 20-page report about major disruptors impacting the industry. The white paper is the result of research by UBM and Euromonitor, which surveyed over 1,000 suppliers and manufacturers covering major food, hotel and food service equipment sectors across Asia.

The white paper discusses where manufacturers and suppliers expect their import and export business to take shape in the next one to three years, as well as how technology such as Internet of Things (IoT) and automation will shape their future markets and affect business decisions.

“This bespoke study on smart innovations for the food and hospitality industry is demonstrative of FHA’s commitment to drive our industry forward, said Rodolphe Laymese, Project Director, Food & Hospitality, UBM, organiser of FHA.

“It provides invaluable insight into the Asian and global food market which we proudly share with all members of the community at our 40th anniversary milestone event.”

“The food and hospitality sector is undergoing rapid transformation in business and production processes because of technological changes. The white paper focuses on how technology impacts and changes how the industry conducts its business, the processes and how it will help the industry improve operational and work efficiencies, as well as productivity,” said Ivan Uzunov, Research Manager, Euromonitor.

The paper will only be available to preregistered FHA delegates. It will also be made available to all delegates attending Euromonitor’s session, Smart Innovations Transforming the Food & Hospitality Landscape by 2020 at the FHA2018 International Conference.

The three-day conference, held in two venues from 24 to 26 April, will feature industry experts and business thought leaders, sharing perspectives, tips and strategies across five key tracks: Hotels & Resorts, Food Manufacturing and Bakery at Singapore Expo; plus Central Kitchen and Food Services at Suntec Singapore.

FHA is an international showcase of food and hospitality products, equipment and solutions. The four-day mega food and hospitality showcase will return from 24 to 27 April 2018 to two venues – Singapore Expo and Suntec Singapore.

The event will host its biggest-ever industry congregation with 4,000 international exhibitors from more than 70 countries and regions, spanning vertical sectors from food and drink, food service and hospitality equipment to hospitality technology service providers. Experiential networking and learning opportunities are available through new and improved speciality zones. Some 78,000 trade professionals from over 100 countries and regions are expected to attend.

Hashtag: #FHA2018

3 October 2017

Adapting workforce culture to the new normal

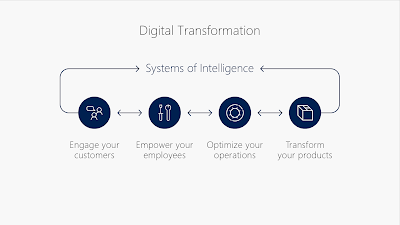
Source: Microsoft. Digital transformation requires change both externally and internally.

The changing face of Singapore’s workforce has resulted in a need for organisations to foster a new culture of work to achieve digital transformation success, a Microsoft study* has concluded. In fact, 77% polled felt that more can be done by their organisations to invest in culture development.

The Microsoft Asia Workplace 2020 Study found the following factors influencing the culture of work in Singapore today:

Increasingly mobile workforce and exposure to new security risks

The rise of mobility and proliferation of mobile and cloud technologies have resulted in individuals working across multiple locations and devices. In fact, the study found that only 38% of respondents are spending all of their work hours in the office, and 84% of respondents are working off personal smartphones. The latter raises new security challenges for organisations.

The rise of diverse teams

The research also found that 26% of workers in Singapore are already working in more than 10 teams at any one point in time. This makes the availability of real-time insights and collaboration tools crucial to get work done.

Gaps in employees’ digital skills even as leaders are in the process of embracing digital transformation

As the bar is raised with new technologies adopted across industries, deployment is uneven. In fact, 74% of respondents feel that more can be done to bridge the digital skills gap among workers.

Said Borko Kovacevic, Director, Productivity Solutions, Microsoft Singapore: “The rise of digital technologies, along with a new generation of Millennials entering the workforce, has brought about a need to address changing workers’ expectations, knowledge and skills, as well as the tools they use. And with more than half of the world’s Millennials residing in Asia, the workplace will need to transform to adapt to the technology habits of these digital natives. In addition, due to deployment of advanced and emerging technologies, organisations need to relook at reskilling its workforce to develop creative and strategic skills for the future.”

Even as 75% of business leaders in Singapore acknowledge the need to transform into a digital business in order to succeed**, successful digital transformation will ultimately depend on people and the tools they are provided with.

“People are at the heart of digital transformation. Their expectations, knowledge and skills, as well as the tools they use for work, are determining factors in the level of transformation that any organisation can achieve. The challenge that they face now is how to implement new ways to foster a modern culture of work to better empower Asia’s workers, especially those at the frontline. By estimates, there are 2 billion firstline workers globally, and make up majority of our workforce today,” said Kovacevic.

Firstline workers serve as the initial point of contact between companies and the rest of the world - they are first to engage customers, represent brand, and see products and services in action, Microsoft said. The company suggests unlocking the potential of employees, organisations need to address and elevate their workforce, especially firstline workers, through addressing the core values of the new culture of work: 

Unlocking employees’ creativity

Collaboration fuels innovation through sharing of ideas and enables flexibility in how people work through a connected experience, while working seamlessly across devices. However, the Microsoft Asia Workplace 2020 Study found that majority of respondents feel restricted in the way they work today, with 58% highlighting that they needed to be physically present in office as equipment or tools used for their line of work is only available in the workplace.
Fuelling teamwork

By giving all workers a universal toolkit for collaboration, organisations offer its people choice and ownership as to how they work together and collaborate in real-time. In fact, the Microsoft Asia Workplace 2020 Study found that two in five workers highlighted that access to technology for collaboration such that they can respond in a timely manner to internal and external requests was important in their line of work. 

Strengthening security

Today, 61% of respondents are working on employer-issued PCs, but 84% are also working on personal smartphones or using corporate devices for personal activities, which underscores potential security risks. In fact, 66% of respondents admitted to checking personal emails on company-issued devices, and are doing so for the convenience. Therefore, leaders need to strengthen their security not to put organisation’s confidential data at risk to address the need for workers to work without barriers and without impeding productivity. 

Making it simpler

With the rise of apps, devices, services and security risks in the workplace, there is a need to streamline the IT management, break down service siloes so that disparate data can be combined and reasoned in new ways and reduce complexity. In fact, a Microsoft Asia Pacific IT leaders study*** found that 72% of IT decision makers (ITDMs) in Singapore agreed that there is a need to reduce complexity of managing their existing IT security portfolio.

“We believe that every worker – from the factory floor to the front desk, to the executive boardroom – can contribute to an organisation’s collective endeavours. It is our view that involving firstline workers in digital transformation will drive unprecedented opportunity – for workers, the organisations that they work for, and the industries and society at large,” added Kovacevic. “At Microsoft, we see the opportunities that can be unlocked with technology by equipping frontline workers with the right tools, such as Microsoft 365. Ultimately, digital transformation projects can only succeed if the right tools are in place for workers to leverage and maximise upon.”

Microsoft has been diversifying the Microsoft 365 family to address workforce challenges with Microsoft 365 F1, a version of Microsoft 365 which provides purpose-built capabilities that help foster firstline culture and community, train and upskill employees, digitise business process, deliver real-time expertise, and minimise risk and cost. New intelligent search capabilities, a vision for intelligent communications centring on Microsoft Teams, and security and IT management enhancements to help customers stay secure and compliant were also introduced at Ignite:

- Microsoft 365 F1 brings together Office 365, Windows 10, and Enterprise Mobility + Security to empower the more than two billion firstline workers worldwide, who serve as the first point of contact between a company and its customers, or who are directly involved in making products.
- A new vision for intelligent communications, including plans to bring Skype for Business Online capabilities into Microsoft Teams, along with cognitive and data services. This makes Teams the true hub for teamwork in Office 365, including persistent chat, voice and video.
- Intelligent search experiences use AI and machine learning to deliver more relevant search results across Microsoft 365.

- Microsoft 365 is delivering improved advanced threat protection (ATP) features like enhanced anti-phishing capabilities, expanded protection to SharePoint Online, OneDrive for Business, and Microsoft Teams and integration between cloud and on premises identity threat detection capabilities.

- For organisations still on Office 2007, end of support will happen on 11 October. Customers who are still using Office 2007 products and services are encouraged to move to Office 365 or Microsoft 365 to stay supported, and ensure uninterrupted support from Microsoft.

Kovacevic said: “With cloud-based productivity tools being a key pick among Asia’s mobile workers to drive greater collaboration among teams, we urge organisations to take the opportunity to evaluate Microsoft 365 as an option to modernise their workforce.”

Source: Microsoft. Infographic illustrating findings of the Microsoft Asia Workplace 2020 Study,
Source: Microsoft. Infographic illustrating findings of the Microsoft Asia Workplace 2020 Study,

Interested?

Read the TechTrade Asia blog post about the Ignite announcements

*Microsoft Asia Workplace 2020 Study, conducted between February and March 2017 involving 4.175 respondents in 14 Asia markets. The 14 markets include Australia, mainland China, Hong Kong, Indonesia, India, Japan, Korea, Malaysia, New Zealand, the Philippines, Singapore, Taiwan, Thailand and Vietnam. All respondents were prequalified as at least spending 30 hours per week in a full-time role, or spending at least 20 hours per week in a part time role. This included 307 respondents from Singapore.

**Microsoft Asia Digital Transformation Study. The study surveyed 1,494 business leaders from Asia, including 118 from Singapore. All respondents were prequalified as being involved in shaping their organisations’ digital strategy. The study found that only 34% of business leaders in Singapore have a full digital transformation strategy while half are in progress with specific digital transformation initiatives for selected parts of their business. Another 16% of respondents said they had a very limited or no strategy in place.

***Microsoft Asia Pacific survey of 1,200 IT leaders across 12 markets, including Australia, mainland China, Indonesia, Hong Kong, Taiwan, Korea, Malaysia, New Zealand, Philippines, Singapore, Thailand and Vietnam. Four in 10 (41%) of respondents are working in organisations with 250 to 499 PCs; 59% work in organisations with 500 and more PCs.

18 September 2017

What we really want in chatbots: Amdocs

A study of over 2,500 consumers CEOs and other senior decision makers on artificial intelligence (AI) spending at some of the largest communications and media companies in the region revealed how plans for a rise of the robots for frontline customer interactions could be hampered by wrong investment choices and a lack of human talent. These are part of the findings from a commissioned study conducted by Forrester Consulting on behalf of Amdocs in the Americas, Europe and Asia.

Nearly a third (31%) of consumers in Asia interact with virtual agents at least once a week. While 46% say it is convenient and saves time (46%), 47% also say they had no other option. If offered a choice, 83% would prefer to speak to a human since human agents better understand their needs (81%) and can address multiple questions at once (60%). Bots, say consumers, cannot deal with complex requests (their biggest problem), deliver personalised offers as well as humans (the second-biggest problem) or understand human emotions (the third-biggest problem).

Consumers also have strong views on how they want bots to look like and behave. Forty-eight percent prefer their bot to look like a human, as opposed to 20% who want to see an avatar. While 43% of consumers are neutral, 42% prefer them to be female, rather than male (15%). In order of importance, sounding polite, intelligent and caring were ranked the highest in terms of preferred bot personality traits, followed by being fully customisable and funny. Conversely, sounding serious and authoritative ranked much lower than other attributes, receiving 14% and 12% of the vote respectively.

The research has shown that service providers priorities are not investing in the right areas in terms of their AI investments. Thirty-eight percent of service providers in Asia are prioritising AI investment in increasing information security and privacy and 33% are focusing on speed of response. Yet customers would rather have bots deliver better personalisation and more comprehensive information. Both are lower on service providers’ priority lists at 8% and 4% of respondents saying they are important. 

Thirty-one percent of service providers are also creating avatar images for their bots whereas consumers prefer human-like images. They are also investing in undesirable features - more than half (56%) of service providers are building bots that sound serious and nearly a quarter (24%) are making them sound authoritative. The fact that 39% of consumers experience problems with today’s bot services but do not complain about it means the industry is working in the dark, Amdocs said. 

Eighty-seven percent of service provider AI decision makers in Asia say that 85% of customer interactions will be with software robots in five years’ time. And almost a half of these decision makers (46%) fear they are lagging behind their competitors in the use of AI to improve the customer experience. To catch up, over a half (58%) plan to increase their AI budgets by at least 6% in the next 12 months and 87% intend to expand their AI workforce within the year. 

But this expansion might still not be enough, Amdocs said. Contrary to the common perception that tomorrow’s service provider will be run more by robots than humans, only 4% of service providers see AI as the opportunity to replace a large number of staff. Most decision makers (67%) actually see the lack of human skills to set up and run AI as one of the top two risks to delivering on their AI strategies, just behind technology not being mature enough (79%). A third are seeking external support, predominantly from their existing vendors as opposed to native AI solution providers (25% vs 8%).

“Consumers have a good sense of how bots can serve them, better-developed than perhaps the industry’s. Their level of frustration with today’s bots is striking; a third even say they will take their business elsewhere if the poor service continues,” says Gary Miles, GM, Amdocs. "The good news is consumers actually believe that if anyone can get AI right, the communications and media industry can. And that’s ahead of banks and retailers. So AI could be a winning gambit for service providers as long as they sync up their AI investment priorities with what customers actually want.”

“The research shows, however, that many service providers do not believe they will be able to achieve this on their own,” added Miles. “They are mostly turning to their existing vendors and not to native AI solution providers, probably in order to ensure AI does not become another tech silo that is hard to scale and manage."

The research covered consumers and senior service provider decision makers in Asia, providing a wealth of market-, gender-, age- and role-based information. An equal mix of 2,575 female and male consumers between the ages of 18 to 74 were surveyed, as well as ten service provider executives from the region’s top communications and media service providers, half holding C-level roles.

Interested?

Check out research highlights by video

8 August 2017

Qualtrics explores customer expectations in Asia Pacific

  • Around 75of Singapore and Hong Kong consumers indicate it is very or extremely important for organisations to respond to their feedback, markedly higher than Australia (64%) and New Zealand (52%).
  • Among the four countries, Singaporeans are the most unforgiving as only 23% are likely to continue using that brand if their feedback is ignored.
  • Nearly half of Singapore respondents (46%) expect a response from an organisation within the same working day.
Qualtrics, the experience management software provider, has released the results of its inaugural study* on customer experience (CX) in Asia Pacific. The Asia-Pacific Region’s Changing Customer Experience Environment report reveals differences in perceptions across different locations.

Qualtrics believes that companies are witnessing an “experience gap” – which is referred to as the gap between the experience that companies believe they are delivering and the experience their customers are actually receiving. Businesses today are awash with operational data (O data), which tells you what has happened. What they need to start collecting is experience data (X data), which will allow them to garner insights into why things are happening. Having both data sets will allow companies to reduce the experience gap and hence, positively impact the operational metrics of the business.

“Qualtrics is committed to helping brands in Asia Pacific measure, prioritise and optimise the experiences companies deliver across the four core foundational aspects of business – customers, products, employees, and brands. This study offers a deep dive into the region’s specific customer experience demands and offers key insights into the evolving landscape,” said Bill McMurray, MD of Asia Pacific and Japan at Qualtrics.

“Consumers in Asia Pacific have a wide variety of choice and if they do not like the service an organisation delivers, they will simply find another organisation that does it better. Ultimately, brands need to understand that nailing customer experience management can generate immense rewards, while getting it wrong will result in loss of customers, decreased revenue, reduced market share and even a damaged brand reputation.”

With 63% of business leaders in Southeast Asia having listed CX as their top business priority, according to Forrester, more businesses in the region will recognise the need to increase their efforts across all customer touchpoints, and international companies will also need to pay more attention to localising their customer management initiatives. The study reveals these top ten CX insights across Asia Pacific:

Customers demand action
Approximately 75% of Singaporean and Hong Kong consumers indicated that it is very or extremely important for organisations to respond to their feedback, markedly higher than Australia (64%) and New Zealand (52%).

Ignoring feedback is a fireable offence
On average, 39% of respondents in the Asia Pacific region are unlikely to continue doing business with an organisation that does not respond to their feedback. Singaporeans are the most unforgiving – only 23% are likely to continue using that brand if their feedback is ignored.

Fix it the first time
Just 2% of respondents feel that first-time resolution is anything less than moderately important. Some of the top frustrations cited are having to ask for the same information multiple times, and not having issues resolved the first time.

Respond today, not tomorrow
Nearly half of all respondents (46%) expect a response from an organisation within the same working day. Hong Kong customers appear to be more demanding, with 68% expecting brands to reply to their feedback on the same day.

Beware of the experience gap
Organisations must prioritise minimising the amount of effort customers exert to have their issues resolved. Companies must learn what customers’ value most in the experience you provide to them and then ensure that these aspects are executed at the highest level.

Make customers believe
Make sure your consumers know that you are listening and acting on their feedback. While Asia Pacific customers are keen to provide feedback, with 83% being likely to complete a customer experience survey from an organisation they deal with, 37% of these customers are uncertain as to whether organisations listen to and act on it.

Invest in the online experience
Online processes and offerings makes organisations more efficient and enable rapid, effective scaling. Results show that more than half of Asia Pacific customers (58%) are open to making the leap to online-only offerings.

Be one easy call away
While customers are more open to online channels for services and feedback, brands should still make it a point to have their phone numbers readily available to customers in the case they feel they need to contact the organisation. Eighty-four percent of customers thought it was important to have a company contact number on the home page or within a single click of it.

Put security first
Customers do not always “see” your security, but they want to know that it is there. Walk the fine line of having publicly accessible information about the company’s security measures, without revealing too much information to potential data thieves. Nine in 10 (87%) of the respondents believe that it is very important to be able to trust organisations with their customer data.

Welcome new technology
Half (48%) of customers would be satisfied dealing with an organisation staffed by artificial intelligence (AI). However, companies must understand which customer experiences to optimise through technology versus the human touch.

When it comes to consumers’ preferences in Singapore, locals ranked service (22%), quality of product (21%) and value for money (18%) as the top three attributes they value when dealing with an organisation. In terms of communicating with a brand, Singaporeans listed email (49%) as their preferred mode of interaction over other channels such phone (23%), online chat (15%) or face-to-face (13%).

On the other hand, the majority of Hong Kong consumers found the product quality to be far more important (55%), followed by service (54%), and trust (43%). In contrast, they prefer to interact with an organisation via phone (31%), instead of email (30%), face-to-face (20%) or online chat (18%).

The Qualtrics XM Platform manages the four core experiences of business - customer, employee, product and brand experience - on a single platform. The platform automatically analyses these touch points, helping organisations uncover key business drivers, predict future customer needs, and retain employees and customers.

Interested?

Download Qualtrics' The Asia-Pacific Region’s Changing Customer Experience Environment report

*The multi-country customer survey polled 1,100 consumers online across four Asia Pacific markets, namely Singapore, Hong Kong, Australia and New Zealand. Nationally representative samples of customers were obtained in each country, with fieldwork taking place in January 2017.

posted from Bloggeroid

19 July 2017

Cards are 52% of payments in Asia, but new tools are emerging

An omnichannel payments strategy is key to creating a seamless customer experience for 79% of merchants and retailers according to benchmark data in 2017 Global Payments Insight Survey: Merchants and Retailers from ACI Worldwide and Ovum.

The study* revealed that although the EMV card standard has lowered fraud prevention costs, fraud continues to shift online. And while merchants and retailers plan to considerably increase investment in payments to improve customer experience (by 50% compared to 2015), more than three quarters of these organisations view security, compliance and fraud management issues as the biggest barriers to their investment decisions.

Principal findings include:

· Cards continue to dominate the payments market for retailers and merchants, making up 52% of payments in Asia

· New and alternative payment tools now account for 10% of global merchant transactions, with contactless cards now accounting for near 2% of transactions in Asia as high sales-volume merchants embrace quick and convenient means of payment

· Six in 10 (59%) of merchants and retailers plan to increase their payments investments during the next 18 to 24 months, up from 50% in 2015

· Payments investment is high in all sectors, with 65% of travel and accommodation companies reporting an increase in investment levels

· Merchants and retailers increasingly expect payments investment to improve the customer experience, but more than 75% indicate security and compliance are the biggest barriers to payments initiatives

· Although 52% of merchants and retailers say their card not present (CNP) losses are growing, 70% say they are satisfied with their CNP fraud prevention tools.

“As commerce becomes increasingly digital, payments technology is critical to improving customer engagement and reducing costs—with 79% of global merchants and retailers noting that an omnichannel approach is key to creating a seamless customer experience,” said Lynn Holland, VP, ACI Worldwide.

“Although there isn’t one path to payments modernisation for merchants and retailers, the benefits of investing in new and alternative payments methods are increasing—in terms of both merchants’ bottom lines and overall improvement of customer experience,” said Matthew Heaslip, Analyst, Ovum. “To stay competitive in this changing retail market, merchants and retailers must foster strong payment partnerships with companies that not only understand their market verticals, but can also help them both improve their omnichannel capabilities and reach new customers.”

Interested?

Read the 2017 Global Payments Insight Survey: Merchants and Retailers report

*For the 2017 Ovum Global Payment Information Survey, which includes merchant, biller, and retail banking components, ACI and Ovum created a 23-point questionnaire, looking at the following criteria for key payments players: significant aspects of existing payments infrastructure; forecasts for spending; areas for investment and perceptions of where payments fit within their broader strategic objectives. This survey was sent to payments decision makers globally in December, 2016—January, 2017. It provides a snapshot of payment perceptions among merchants, financial institutions, and scheduled billing and payment- taking organisations such as higher education, consumer finance and insurance. Overall, 1,475 executives across 15 industry sub-verticals in 25 key global markets responded, resulting in more than 144,000 separate data points on perceptions and expectations of payments among critical payment enablers globally.

Industries surveyed include general merchandise, food service and restaurants, grocery, fuel and convenience, and travel and lodging, based in countries in the Americas, Asia Pacific (APAC) and Europe, Middle East and Africa (EMEA).

posted from Bloggeroid

12 June 2017

Toy and game sales to adults are growing

Global market research company Euromonitor International has found that games and puzzles registered 8% growth in 2016 – outpacing construction toys as the fastest growing toy category globally, but also recording the highest growth for the category since 2002.

Globally, construction toys grew 7.8% in 2016 compared to double-digit growth from 2015, but continued to hold the largest share of the traditional toys and games market at US$10 billion, followed by games and puzzles at US$9.5 billion.

Construction toys are expected to make a comeback as the fastest growing toys category globally with a forecasted compound annual growth rate of 6.8% from 2016 to 2021.

“Continued growth in sales to adults illustrates that children are retaining interest in toys into adulthood on a scale not seen in previous generations,” says Matthew Hudak, Toys and Games Analyst at Euromonitor International. “Categories with proven multigenerational appeal like construction, remote control, and action figures are therefore expected to see the fastest growth over the next five years.”


posted from Bloggeroid

26 April 2017

Bangkok is the most-visited destination in Asia Pacific

Source: Mastercard. Cover of the Mastercard Asia Pacific Destinations Index 2017 report.
Source: Mastercard. Report cover.
While Bangkok, Thailand remains the most-visited destination in the Asia Pacific region, Singapore continues to lead the Thai capital in total visitor expenditure, according to the latest findings from the Mastercard Asia Pacific Destinations Index 2017*.

Singapore has tracked a 18% leap in visitor spend over 2015 and 2016. One of only five destinations of the top 20 by total expenditure to reach a minimum spend of US$200 per day, Singapore attracted the highest spending visitors at US$254 per day, followed by Beijing, mainland China (US$242), Shanghai, China (US$234), Hong Kong (US$211) and Taipei, Taiwan (US$208).

Half of the top 20 most-visited destinations in Asia Pacific saw more than 10% growth in international overnight arrivals from 2015 to 2016. Destinations that benefitted most from this growth include Northeast Asian and Southeast Asian markets – Seoul, Korea (32.7%), Osaka, Japan (23.8%), Bali, Indonesia (22.5%), Tokyo, Japan (22.2%), Hokkaido, Japan (21.9%), Chiba, Japan (21.5%) and Pattaya, Thailand (20.6%).

This growth provides significant opportunities which governments, tourism bodies, and merchants can benefit from, including greater economic, cultural and infrastructural development.

Overall, overnight arrivals** to the 171 Asia Pacific destinations in 2016 stood at 339.2 million (9.8% CAGR from 2009 to 2016), led by Bangkok which tracked 19.3 million visitors. Singapore (13.1 million) came in second place, followed by Tokyo (12.6 million), Seoul (12.4 million) and Kuala Lumpur, Malaysia (11.3 million). China stands as Asia Pacific’s most avid outbound travel market, having contributed 55 million international overnight visitors to the region last year or 16.2% of the total.

The top ten Asia Pacific destinations ranked by international overnight arrivals:

1. Bangkok – 19.3 million

2. Singapore – 13.1 million

3. Tokyo – 12.6 million

4. Seoul – 12.4 million

5. Kuala Lumpur – 11.3 million

6. Phuket, Thailand – 9.1 million

7. Hong Kong – 8.9 million

8. Pattaya – 8.1 million

9. Osaka – 7.4 million

10. Taipei – 7.4 million

Visitors to Asia Pacific destinations are travelling to the region more, and doing so for longer periods. In 2016, visitors to the region stayed for a total of 1,768.7 million nights, an 8.1% CAGR from 1,023.1 million nights in 2009. Bangkok took the lead with 87.6 million nights, while Sydney came in second place with 87.5 million, followed by Kuala Lumpur at 76.7 million.

In particular, Sydney’s second-place position is especially outstanding compared to its number of overnight arrivals. Taking 20th place in the latter ranking, Sydney’s ratio of average number nights stayed versus number of overnight arrivals is shared by fellow Australian destinations Melbourne and Brisbane on the Index. As many tourists have to travel a distance to reach Australia, they are more likely to stay for longer periods to make their journey worthwhile.

The top ten Asia Pacific destinations ranked by total nights stayed:

1. Bangkok – 87.6 million

2. Sydney – 87.5 million

3. Kuala Lumpur – 76.7 million

4. Tokyo – 74.3 million

5. Melbourne – 62.9 million

6. Bali, Indonesia – 62.4 million

7. Singapore – 60.7 million

8. Seoul – 56.0 million

9. Brisbane – 51.8 million

10. Taipei – 47.8 million

Spurred by Asia Pacific’s burgeoning middle class, overall tourism expenditure in the region jumped from US$141.5 billion in 2009 to US$244.9 billion in 2016, an 8.2% CAGR Moreover, Asia Pacific’s top 20 source markets contributed US$201.5 billion to the region’s tourism revenues in 2016.

The mass of tourists from Northeast Asia have helped to boost these earnings. Key findings from the Index revealed China (17.7%) and South Korea (8.8%) as the largest contributors to tourism expenditure in Asia Pacific. In fact, these two markets were also top source markets for Singapore (China visitors were the No. 1 tourist segment), Bangkok (China  No. 1) and Tokyo (Korea No. 1, China No. 2), the region’s leading destinations by visitor expenditure. As renowned global shopping and dining locales, they are popular amongst affluent Chinese and South Korean tourists seeking new shopping or culinary experiences.

The top ten Asia Pacific destinations ranked by expenditure:

1. Singapore – US$15.4 billion

2. Bangkok – US$12.7 billion

3. Tokyo – US$11.1 billion

4. Taipei – US$9.9 billion

5. Seoul – US$9.4 billion

6. Bali – US$8.7 billion

7. Phuket – US$8.3 billion

8. Kuala Lumpur – US$7.3 billion

9. Sydney – US$6.8 billion

10. Hong Kong– US$6.6 billion

Interested?

Download the Mastercard Asia Pacific Destinations Index 2017 report

*The Mastercard Asia Pacific Destinations Index is an offshoot of Mastercard’s annual Global Destination Cities Index. In recent years, Asia Pacific cities have increasingly dominated the fastest growing and most visited destinations in the world. According to the 2016 Mastercard Global Destination Cities Index, five of the ten most visited cities in the world were in Asia Pacific.

The Asia Pacific Destinations Index takes a more in-depth, focused look at these tourism trends, ranking 171 destinations, including island resorts as well as towns and cities across the region, in terms of the total number of international overnight arrivals; cross-border spending; and the total number of nights spent at each destination. These 171 destinations are drawn from 22 countries across Asia Pacific and represent 90% of all international overnight arrivals within the region.

Public data is used in deriving the international overnight visitor arrivals and their cross-border spending in each of the destinations, using custom-made algorithms. This Index and the accompanying reports are not based on Mastercard volumes or transactional data.


*Overnight visitors stay at least one night in the destination country.

15 March 2017

Digital payment methods popular in Australia

The latest Mastercard Digital Purchasing Survey* reveals that Australian consumers are continuously embracing digital payment technology, with more than four in five (82%) Australians using tap and go (contactless methods) to make payments every week. In fact, over one third of Australians have been annoyed when a store did not offer tap and go, and one in ten even avoid such a store.

Australians are using contactless cards most frequently at supermarkets (54%), general retail stores (22%), and petrol stations (11%).

Garry Duursma, Head of Market Development and Payment Innovation for Mastercard Australia and New Zealand, said, “Overall Australians see tap and go as a convenient and time saving way to pay. The survey findings indicate an increasing demand on retailers to take advantage of more innovative payment methods, with the majority of Australians believing that businesses that offer contactless technology are making it easier for their customers. Almost half of Australians are looking for a better and more enhanced shopping experience.”

Consumers are also becoming more aware of the benefits of contactless in security terms, with contactless card payments offering the same level of protection as chip and pin payments. In fact, Mastercard’s Zero Liability on card payments means that contactless is also safer than carrying cash, which could be lost or stolen. The increase in confidence in the security of contactless as a method of payment is demonstrated in the research findings, which show 64% of Australians are now ‘not very’ concerned about security when using contactless, up from 46% in 2014.

“Australians have largely embraced contactless payments as a part of their everyday lives, indicating that consumers are starting to gain a real understanding and appreciation for the benefits of contactless,” said Duursma. “There are a wealth of innovative payment technologies available to consumers today, and given the positive uptake in Australia, we expect to see more developments in this area, as people continually look for convenience and time saving in their busy lives.”

While tap and go becomes ubiquitous, survey findings indicate that mobile payments remain a growth area in Australia, with only one quarter (26%) of Australian consumers responding that they are aware of having contactless payment options on their mobile phone. Of those that are not aware of having a contactless option on their phone, 36% say that they would consider using it and over half (54%) of all Australians wish they knew more about digital wallet technology – an attitude that represents a positive trend towards adoption.

Globally, Mastercard is shaping the digital future by creating new and secure ways for consumers to pay across all channels and devices – from digital wallets to tokenisation to new solutions in safety and security.

Detailed findings:

Tap and go/contactless
  • More than four in five (82%) Australians are using tap and go/contactless every week.
  • Eighty-four percent of males, 79% of females
  • Eighty-eight percent of Millennials, 83% of Generation X, 72% of Baby Boomers
  • In terms of geographies, 85% come from New South Wales/Australian Capital Territory (NSW/ACT) compared to 74% South Australia (SA) and 72% from Western Australia (WA)
  • This is up from 76% of Australians in December 2015
The benefits of tap and go/contactless continue to be clearly perceived as convenience and time saving.
  • Eight in 10 (81%) of all Australians say that it ‘saves time / quick’ and this increases to 86% among ‘daily’ users (up from 77% December 2015)
  • Eighty percent of all Australians say that it is convenient and easy (up from 75% in December 2015)
  • One third of Australians have been annoyed at some time that a store hasn’t offered tap and go/contactless technology. Nearly half (46%) of Millennials say this compared to 20% of Baby Boomers
  • One in ten (11%) Australians have at some occasion avoided a store that didn’t offer tap and go / contactless. Fifteen percent of Millennials say this compared to 5% of Baby Boomers 
  • Seven in 10 (71%) Australians say that businesses that do offer contactless/tap and go technology are making it easier for their customers (up from 62% in December 2015). A third say that these businesses are ‘modern and innovative’
Almost half (43 %) of Australians are looking for a better and more enhanced shopping experience.
Concern about using contactless transactions at shops and petrol stations continues to recede. The majority (64%) of Australians are now ‘not very concerned’ about security when using tap and go/contactless (compared to 58% in December 2015 and 46% in 2014).

Contactless payments via mobile

One quarter (26%) of Australians are aware of having contactless payment options on their mobile phone.
  • This was reported by 34% of Millennials, 24% of Generation X, 18% of Baby Boomers
  • A third (35%) of people who use tap and go/contactless every day have tap and go on their mobile phone
  • Of those respondents that are aware that they have mobile contactless capability, 28% make use of it weekly and 72% less often

*This study was conducted online during December 2016 using a sample of 1,000 Australians aged between 18 and 64 years old across Australia. Age, gender and area quotas were applied to the sample.

9 March 2017

Interest grows in cold pressed juices

Source: Techsci Research. Cover for the report on global the cold pressed juices market.
Source: Techsci Research.
According to a TechSci Research report, Global Cold Pressed Juices Market By Nature, By Type, By Point of Sale, Competition Forecast and Opportunities, 2012-2022, the global cold pressed juices market is projected to grow at a CAGR of over 10% from 2016 to 2022 on account of rising disposable income levels, growing awareness among consumers, aggressive marketing strategies of major companies, easy availability of cold pressed juices and robust distribution network of major players in different regions across the globe.

In 2015, global GDP per capita in terms of purchasing power parity reached US$15,470.15 from US$14,020.31 in 2012. Rising health concerns and increasing global healthcare expenditure per capita to US$1,083.28 in 2015 from around US$1,026.16 in 2012 are also fuelling demand for cold pressed juices across the globe.

Additionally, rising focus on preventive healthcare, growing awareness among consumers about the harmful effects of consuming products manufactured using synthetic ingredients and increasing demand for organic cold pressed juices is projected to drive sales of cold pressed juices. Although conventional cold pressed juices dominated the global cold pressed juices market, there has been robust growth in demand for organic cold pressed juices. This can be attributed to rising awareness about health and nutritional benefits of organic products. 

“Rising health awareness, expanding youth working class population base and rapidly changing consumer preference towards organic cold pressed juices over conventionally manufactured cold pressed juices due to its high nutrient content has driven sales of cold pressed juices across the globe. 

"Moreover, greater accessibility of these products through supermarkets/hypermarkets, brick and mortar stores and online channels along with continuous developments in supply chain network across the globe are also anticipated to drive demand for cold pressed juices across the globe through 2022.” said Karan Chechi, Research Director with TechSci Research, a research based global management consulting firm.

Some of the leading players in the global cold pressed juices market include PepsiCo’s Naked Juice, Hain Celestial’s BluePrint, Starbucks Evolution Fresh, and Suja Life. 

Interested?

1 March 2017

Digital wallets capture the Asia Pacific imagination

Digital wallets have dominated the payments discussion, with the topic in 83% of Asia Pacific conversations of new ways to pay, and 75% of global conversations tracked in the 2017 edition of the Mastercard Digital Payments Study*.

At the same time, consumers are showing an increased interest in the application of new technologies to make shopping faster, easier and more secure. The topic of virtual reality generated the most positive sentiment globally and in Asia Pacific (100% positive) among emerging technology topics, as shoppers imagine completing a purchase with a nod of their heads.

Now in its fifth year, the study, developed in partnership with PRIME Research and Synthesio, analysed more than 3.5 million conversations from the past year across several social media channels, including Twitter, Facebook, Instagram and Weibo.

“Technology is making the promise and the potential of a less-cash life a reality for more people every day,” said Marcy Cohen, VP of digital communications at Mastercard. “This year’s study notes a change in the level of interest for new ways to shop and pay that only a few years ago would have seemed far-fetched.”

The increased acceptance of digital wallets in-store, online and in-app generated more than 2 million mentions, with 84% of them on Twitter. Beyond the payment, consumers looked forward to additional functionality like storing loyalty cards and supporting closed-loop public transportation systems.

The activation of newer technologies like artificial intelligence and smart home assistants was the second most discussed payment topic throughout 2016. These new ways to pay generated particularly strong consumer interest in the fourth quarter, as people discussed how they might shop with newer, smarter devices.

Wearables was the leading emerging technology topic (37% of all conversations on emerging technology), driven by partnership announcements from technology developers and payment providers. In Asia Pacific, discussions among consumers were particularly positive (93% positive) with rumours of mobile wallet integration with wearables driving the conversations.

Smart assistants, virtual reality and artificial intelligence also emerged as new payment technology interests.

In their conversations, people continually noted that the success of new technologies and new ways to pay will be dependent on the security and protections delivered beyond what’s available today. Nearly half of consumers worldwide (43%) and in Asia Pacific (45%) expressed interest in biometrics and other forms of authentication to deliver enhanced security, reduce fraud and move beyond traditional passwords.

New developments in facial recognition and fingerprint and touch authentication drove over half of biometric/authentication conversations (51%). In Asia Pacific, consumer excitement around new biometric and authentication technologies, particularly in India, drove positive sentiment (66% positive) for safety and security discussions.

Facial recognition conversations focused on the Mastercard Identity Check Mobile app, Google’s Hands Free app and a Snapchat patent to incorporate a payments platform with real time services.
Complaints centred on entering, forgetting and resetting passwords. Consumers expressed interest in getting rid of passwords altogether with easier, improved authentication.

Source: Mastercard. Infographic on the results of the Mastercard Digital Payments Study 2017. The Asia Pacific region views wearables very positively.

Hashtags: #MWC2017, #MWC17

*Mastercard, in partnership with PRIME Research, conducted its fifth annual Digital Payments Study, designed to identify expanding conversations on new ways to pay. Mining more than 3.5 million social media posts via Synthesio over the past year across Twitter, Facebook, Instagram, Forums, Google+, YouTube, Vkontakte and Weibo and covering 188 markets across the globe, the resulting report reflects insights into new mobile payments product and category trends across regions and countries.

13 February 2017

Cheese benefits from image as a premium product in Indonesia

More Indonesian families, particularly in the big cities, are expected to start using cheese as a main ingredient in their meals. According to research firm Euromonitor, more consumers have started to prepare Western foods which use cheese as an ingredient by themselves at home. These include pizzas, pasta dishes, cakes, pastries and toast. Cheese has become very popular to serve with white bread as a substitute for chocolate sprinkles, jam or honey.

An increasing number of foodservice outlets and rising number of new menus using cheese by existing foodservice outlets may also prompt faster volume growth of food-service sales of cheese in the forecast period of 2016 to 2021, Euromonitor said.

Kraft was named as the leading cheese brand in Indonesia in 2016, with Kraft Ultrajaya Indonesia PT commanding a 61% share of value sales. The company’s dominant position is attributed to its early entry into the Indonesian cheese market, a wide variety of other processed cheese products and aggressive marketing, using both television advertisements and below-the-line activities.

Interested?

Read the executive summary for the Euromonitor Dairy in Indonesia report, dated December 2016

Read the WorkSmart Asia blog post about popular brands in Indonesia

29 January 2017

Successful organisations display collective ambition: Aon Hewitt

  • All surveyed organisations said collective ambition was key to their growth trajectory. 
  • Organisations with leaders who are united under a singular vision, purpose, and aspiration develop more effective succession pipelines.

A study* of Chief Human Resource Officers (CHROs) from more than 15 industries representing 1.1 million employees demonstrated that organisations who drive stellar growth have "collective ambition", according to the People Fuel Growth study by Aon Hewitt, the global talent, retirement, and health solutions business of Aon.

Collective ambition is fuelled by competitive, yet collaborative leadership and ensures achievement of common goals. The leadership team has a strong desire to be successful, but is also highly aware that that this only occurs when leaders are able to work jointly.

In order to achieve collective ambition, the Aon Hewitt People Fuel Growth study reinforces the belief that ambition in absence of a group is meaningless and the leadership team must have an understanding of growth and how to achieve it. The study found it essential that:

1. Leaders review the organisation's mission and growth plan regularly.

2. Hold meetings to discuss their growth plans at least once a year.

3. Have a regular cadence for their senior leadership meetings; most organisations surveyed meet on a monthly basis to ensure leaders work in unison to accomplish organisational goals.

4. Goals are tied to concrete measures. In high-growth organisations, these are usually crafted so that all employees understand how they contribute to and share in organisational success.

Na Boon Chong, Senior Client Partner, Aon Hewitt Singapore, said: "Collective ambition means that leaders are united under a singular vision, purpose, and aspiration. By uniting leadership around a common goal, supported by intentional alignment from a "people" standpoint and customer centricity that ensures relevance, it helps organisations to best leverage their talent and drive growth from the top down, be it at a firm or at a national level."

Interested?


Learn more about the study

Read a white paper on study findings

*The People Fuel Growth study sought to understand the impact people have on growth through interviews with CHROs of high-growth Fortune 1000 companies, representing 1.1 million employees across more than 15 industries. Aon Hewitt also analysed its proprietary data to identify differences between high and average growth firms. 

25 January 2017

TechSci Research sees potential in organic dairy market

Increasing health consciousness, an expanding urban population base and growing consumer spending on organic products will drive the global organic dairy products market through to 2021, says TechSci Research, a research-based global management consulting firm.

Global Organic Dairy Products Market By Product Type, By Region, Competition Forecast and Opportunities, 2011 - 2021 predicts that the global market for organic dairy products will grow at a CAGR of over 11% during the 2016-2021 forecast period. The forecast is based on anticipated expanding product portfolios, easy availability of organic dairy products, robust distribution networks, rising Internet penetration and aggressive marketing strategies adopted by major companies.

Organic drinking milk, organic yoghurt, organic cheese, organic butter, organic milk powder and organic probiotics are the major segments in global organic dairy products market, with organic drinking milk and organic yoghurt dominating the market, globally. However, on the back of attributes such as increasing immunity, energy, mental strength, reduction in risk of cancer and chronic fatigue and cure for irritable bowel syndrome intestinal homeostasis, demand for organic probiotics is expected to witness the fastest growth in global organic dairy products market.

Karan Chechi, Research Director with TechSci Research listed various reasons why sales of organic dairy products are up across the globe:
  • Rising awareness about health benefits associated with organic dairy products, 
  • Increasing average household annual spending on dairy products, 
  • Rapid urbanisation, 
  • Easy accessibility of these products through retailers and online channels, 
  • Changing consumer preferences, 
  • Continuous developments in supply chain network and 
  • Implementation of government initiatives to encourage farmers to switch to organic farming
"In addition, introduction of innovative organic dairy products such as energy based milk drinks, flavoured organic milk drinks and a variety of organic yogurt and other organic dairy products are expected to further propel growth in global market for organic dairy products through 2021,” said Chechi.

Organic Valley, Omsco, Whitewave, and Aurora Organic Dairy are few of the brands operating in global organic dairy products market.

24 January 2017

PwC launches APAC research centre for asset and wealth management

Source: PwC. PwC is to open an Asset & Wealth Management Asia-Pacific Research Centre in Singapore.

PwC has launched its Asset & Wealth Management (AWM) Asia-Pacific Research Centre, which will be headquartered in Singapore. With the support of the Singapore Economic Development Board, the AWM Asia-Pacific Research Centre aims to build capability in AWM in Singapore and across the region.

As an extension of PwC’s Global Market Research Centre based in Luxembourg, the AWM Asia-Pacific Research Centre will help to address the asset and wealth management industry’s market research needs such as identifying new market opportunities through its dedicated market-entry reports, help asset and wealth managers assess their competitiveness, improve their visibility in the market and monitor key trends.

This will be done through the development of in-depth analytical reports to support players in developing their strategy. It will also provide guidance for new players' market-entry aspirations across the Asia-Pacific region and engage in dialogue with regulators and governments in Asia-Pacific through policy papers.

“We are at the beginning of the Asian decade as global economic power and wealth shifts from west to east. The financial services industry in Asia-Pacific is at the cusp of re-engineering and consolidating. PwC’s AWM Asia-Pacific Research Centre will provide clients and other financial institutions with tools to expand their footprint in this region through the provision of market intelligence and supporting thought leadership,” says Justin Ong, Asia-Pacific Asset and Wealth Management Leader at PwC Singapore.

Barry Benjamin, PwC Global Asset and Wealth Management Leader adds, “The impacts of globalisation, technology advances and changing demographics are leading to dramatic shifts in how people accumulate, manage and distribute their wealth. The Centre will play an integral role in advancing research as well as developing perspectives on these challenges.”

The centre aims to build the analyst and research team to 12 over the next five years.

20 January 2017

Cosmetics go organic in a big way

Rising health concerns, and increasing awareness about harmful effects of chemicals in conventional cosmetics and benefits associated with organic cosmetics are expected to drive the global organic cosmetics market through to 2021 according to a TechSci Research report, Global Organic Cosmetics Market By Product Type, By Point of Sale, By Region, Competition Forecast and Opportunities, 2011 - 2021.

TechSci Research, a research-based global management consulting firm. predicts that the global organic cosmetics market is projected to register a CAGR of over 13% during the 2016-2021 period. Organic cosmetics are manufactured using organic ingredients and without the use of chemicals. Growth in global organic cosmetics market can be attributed to factors such as increasing skin diseases, rising disposable income, growing awareness among consumers, increasing focus on environment and animal welfare, a widening distribution channel network coupled with increasing visibility and accessibility to organic cosmetics through retail outlets. Continuous product innovation is also expected to influence the global organic cosmetics market.

Rising standards of living and increasing personal disposable income has driven adoption of these cosmetics across the globe. In 2016, growth in consumption of organic cosmetics was witnessed globally as governments in many countries are taking initiatives to promote and encourage use of organic cosmetics. Additionally, governments in various countries have also laid regulatory, policy and safety legislations to improve quality of organic cosmetics.

Organic cosmetics are generally more popular among females, who accounted for more than 75% of the total organic skincare usage worldwide. L'Oréal, Estée Lauder, Avon, and the Revlon Group are few of the leading players in the global organic cosmetics market on the back of their wide range of product offerings, robust distribution network and huge consumer base. Many key players are also focusing on expanding their distribution network to online channels. However, exclusive retail stores and supermarkets/hypermarkets are anticipated to continue dominating sales of global organic cosmetics market through to 2021.
 
"Increasing pollution and unhealthy working lifestyles has driven adoption of alternatives such as organic cosmetics across the globe, especially among the youth. Younger generations prefer to use organic cosmetics, as it is free from high concentration of chemicals. Growing demand for organic cosmetics with multiple benefits claims such as anti-ageing, moisturising and sun protection factor (SPF) protection is poised to boost growth in global organic cosmetics market. Moreover, companies are constantly advertising organic cosmetics on social networking sites such as Facebook, Twitter, YouTube and other websites such as Instagram, through beauty bloggers to increase brand awareness. All these factors are anticipated to boost adoption of organic cosmetics in developed and developing countries across the globe," said Karan Chechi, Research Director with TechSci Research.

14 January 2017

Mobile apps begin to cannibalise share from each other: Flurry Analytics

  • Mobile usage has hit critical mass.
  • Social and daily habit apps dominated time spent on mobile in 2016.
  • Phablets captured 41% of market share.
  • The decelerating rate of growth could signal market maturity, saturation or simply the end of the app gold rush.

Flurry Analytics, part of the Yahoo Mobile Developer Suite, has released its annual global mobile and application usage study. In its eighth year, the study offers insights on global mobile app usage and trends from the last year on over 2.1 billion smart devices and 3.2 trillion sessions, and shows a new trend towards cannibalisation within the mobile app category, as opposed to taking share from web or television channels.

Throughout 2016, which was also the last year of the first decade for mobile apps, the industry managed another 365 days of growth.

Source: Flurry Analytics. Messaging and social apps were king, followed closely by sports apps.
Messaging and social apps were king, followed closely by sports apps.

“Over the last year, the Flurry footprint grew to track more than 940,000 applications, across 2.1 billion devices, in 3.2 trillion sessions. In this context, we define app usage as a user opening an app and recording what we call a session, as well as the amount of time spent in the application.” said Simon Khalaf, SVP, Yahoo. “Compared to the year prior, overall app usage grew by 11% and time-spent in apps grew by 69%. In previous years, we saw all app categories growing in tandem; however, this year the story is different.

"After shifting the web and television to the rearview mirror, mobile apps started eating their own, with session and time-spent growth in some app categories occurring at the expense of others. While Messaging and Social applications drove year-over-year session growth at 44%, the Personalization category gave up a staggering 46% in session usage. This steep decline in usage can be attributed to diminishing value for users of these products.”

Source: Flurry Analytics. Time spent on mobile apps grew by 69% YoY.
Time spent on mobile apps grew by 69% YoY.

Time spent in the Social and Messaging apps category grew by 394% over the last year, proving to be the driver that helped mobile achieve its year-over-year time-spent growth of 69%. This is a result of consumers using their social and messaging apps as their voice and video calling utilities, as well as the phenomenon that Flurry Analytics calls 'communitainment', communication for the sole purpose of entertainment.

Business and Finance (up 43% in time-spent) and Sports (up 25% in time-spent) categories were immune to growth decay because they are intrinsically centred around mobile activities and rely on real-time data. Flurry Analytics anticipates further growth in these categories as people shift daily habits away from traditional media channels, i.e., watching live sports, market reports and the morning news on their TVs, to the apps on their phones.

Gaming, which was formerly the darling of the mobile industry, saw time-spent decline by 4% year-over-year. Users are increasingly comfortable paying their way through games, with the mobile gaming industry seeing a strong increase in revenues according to Apple’s latest App Store report. Additionally, gaming remains a hit-driven industry. This year’s first “hit”, Pokemon Go, faded relatively fast as consumers lost interest in the game, only returning for marquee holiday events from October to December, for Halloween, Thanksgiving and Christmas respectively. Another notable hit, Super Mario Run, was released too late in the year to make a difference for the overall engagement numbers.

Phablets, in green, are steadily taking share in the form factor game.
Mobile devices are all about phablets now. As forecast in last year’s report, Flurry Analytics reports that phablet devices are now the dominant form factor across the globe, capturing 41% of market share. A larger screen size directly correlates to the growth in media consumption and social engagement app categories. As less mature smartphone markets adopt larger phones, Flurry Analytics believes that phablet share will continue to eat away at medium phones and completely eliminate small phones.

“As the iPhone celebrates its first decade, the mobile industry has grown into a dog-eat-dog world. The decelerating rate of growth could signal market maturity, saturation or simply the end of the app gold rush. But let us put things in perspective. The gold rush in California ended in 1855. A lot of wealth has been generated since then. We are excited to see what app developers do in the next decade and which industry they chose to disrupt, again. Whatever it is, we will be by their side, providing a bit more than picks and shovels.” added Khalaf.

11 January 2017

New book combines services management and marketing best practices with the latest research

Source: NUS. Cover, Winning in Service Markets.
Source: NUS. Cover, Winning in Service Markets.
Tried and tested services management strategies backed by cutting-edge academic research are now available in Winning in Service Markets, a book by Professor Jochen Wirtz, National University of Singapore (NUS) Business School’s Vice Dean (Graduate Studies) and Professor of Marketing.

Professor Wirtz  has adapted his globally leading textbook – Services Marketing: People, Technology, Strategy (8th edition) for industry practitioners. Targeted towards service organisations, the new publication provides comprehensive coverage of the latest academic research and its implications for best-practice service management and marketing across multiple services sector industries.

The secret to winning in service markets is summarised into a five-part framework for readers. With the whole service-profit chain in mind, organisations can cultivate a shared service climate, culture and leadership by:

1. Understanding the power of design and packages of “intangible” benefits and products for employees;

2. Investing in high quality service operations and customer information management processes;

3. Grooming a pool of motivated and competent frontline employees;

4. Building and maintaining a loyal and profitable customer base; and

5. Developing and implementing a coherent service strategy to transform assets into improved business performance.

“Consumers today are more knowledgeable and sophisticated than ever before. Service organisations need to keep up by creating memorable customer service experiences in order to build brand loyalty,” says Professor Wirtz. “Through this book, I hope to help transform the service sector into one that creates value for both customers and employees whilst balancing profitability and growth.”

Jan Swartz, President, Princess Cruises, called the publication a “highly practical book” that is recommended for everyone working in a service organisation. She said, “I love the comprehensive coverage of services marketing and rigour. Also, it is easy to read and full of interesting, best practice examples.”

Professor Wirtz is recognised globally for his excellence in teaching and research with over 40 awards. He holds a Ph.D. in services marketing from the London Business School and his research has been published in some 100 academic journal articles and 130 conference presentations. He has published over 10 books and is an active management consultant in the areas of strategy, business development and customer feedback systems. 

Interested?

Winning in Service Markets is published by World Scientific Publishing and is available for purchase on Amazon and leading book stores. The Kindle version costs US$23.49. Key chapters are also available as standalone publications in e-book and paperback form. Read the abstract